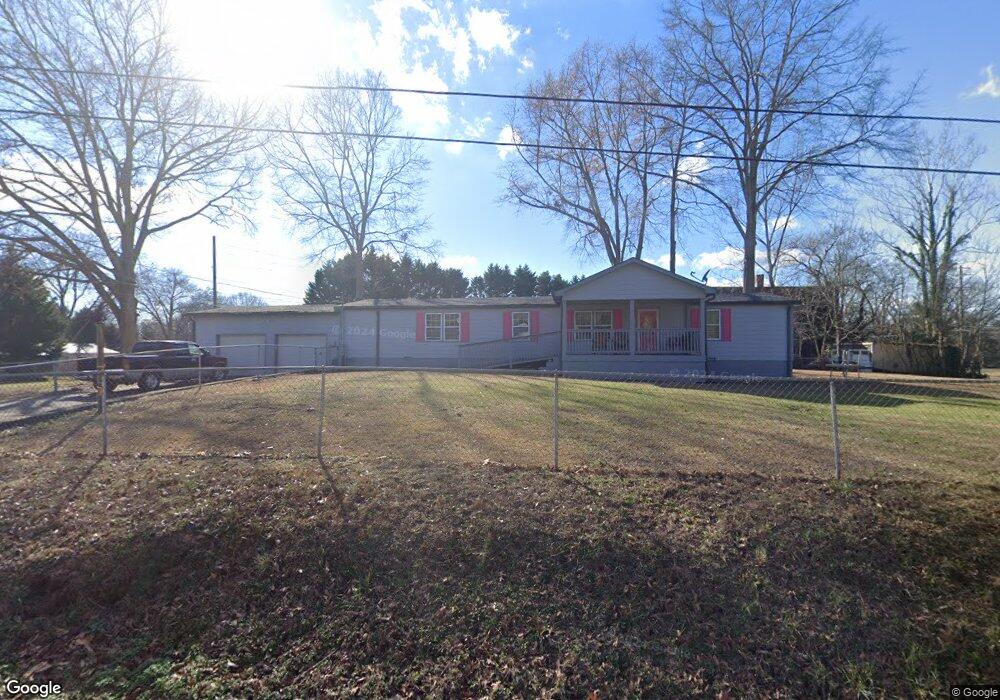
70 Bell St Buford, GA 30518
Estimated Value: $306,000 - $477,000
2
Beds
1
Bath
1,623
Sq Ft
$237/Sq Ft
Est. Value
About This Home
This home is located at 70 Bell St, Buford, GA 30518 and is currently estimated at $384,103, approximately $236 per square foot. 70 Bell St is a home located in Gwinnett County with nearby schools including Buford Elementary School, Buford Senior Academy, and Buford Academy.
Ownership History
Date
Name
Owned For
Owner Type
Purchase Details
Closed on
Aug 15, 2023
Sold by
Maddox Sherry Wansley
Bought by
Maddox Sherry Wansley and Ingram Kimbley Wansley
Current Estimated Value
Home Financials for this Owner
Home Financials are based on the most recent Mortgage that was taken out on this home.
Original Mortgage
$77,000
Outstanding Balance
$63,906
Interest Rate
6.78%
Mortgage Type
New Conventional
Estimated Equity
$320,197
Purchase Details
Closed on
Mar 11, 2021
Sold by
Maddox Sherry Wansley
Bought by
Maddox Sherry Wansley and Ingram Kimbley Wansley
Purchase Details
Closed on
Mar 31, 2015
Sold by
Wansley Joe D
Bought by
Wansley Sherry Eleanor
Purchase Details
Closed on
Mar 19, 2002
Sold by
Wansley Sherry E
Bought by
Wansley Joe D and Wansley Sherry E
Home Financials for this Owner
Home Financials are based on the most recent Mortgage that was taken out on this home.
Original Mortgage
$17,023
Interest Rate
6.86%
Mortgage Type
New Conventional
Create a Home Valuation Report for This Property
The Home Valuation Report is an in-depth analysis detailing your home's value as well as a comparison with similar homes in the area
Home Values in the Area
Average Home Value in this Area
Purchase History
| Date | Buyer | Sale Price | Title Company |
|---|---|---|---|
| Maddox Sherry Wansley | -- | -- | |
| Maddox Sherry Wansley | -- | -- | |
| Wansley Sherry Eleanor | -- | -- | |
| Wansley Joe D | -- | -- |
Source: Public Records
Mortgage History
| Date | Status | Borrower | Loan Amount |
|---|---|---|---|
| Open | Maddox Sherry Wansley | $77,000 | |
| Previous Owner | Wansley Joe D | $17,023 |
Source: Public Records
Tax History Compared to Growth
Tax History
| Year | Tax Paid | Tax Assessment Tax Assessment Total Assessment is a certain percentage of the fair market value that is determined by local assessors to be the total taxable value of land and additions on the property. | Land | Improvement |
|---|---|---|---|---|
| 2025 | -- | $124,360 | $40,000 | $84,360 |
| 2024 | $86 | $121,880 | $33,600 | $88,280 |
| 2023 | $86 | $90,560 | $26,000 | $64,560 |
| 2022 | $233 | $90,560 | $26,000 | $64,560 |
| 2021 | $233 | $58,960 | $16,800 | $42,160 |
| 2020 | $233 | $58,960 | $16,800 | $42,160 |
| 2019 | $210 | $58,960 | $16,800 | $42,160 |
| 2018 | $210 | $38,240 | $5,600 | $32,640 |
| 2016 | $210 | $38,240 | $5,600 | $32,640 |
| 2015 | -- | $38,240 | $5,600 | $32,640 |
| 2014 | $219 | $35,920 | $5,600 | $30,320 |
Source: Public Records
Map
Nearby Homes
- 65 Bell St
- 75 Bell St
- 294 Jackson St
- 55 Bell St
- 4940 Little Mill Rd
- 0 Bell St Unit 8189133
- 0 Bell St Unit 8927565
- 0 Bell St Unit 8972197
- 0 Bell St
- 254 Jackson St
- 301 Jackson St
- 4960 Little Mill Rd
- 0 NE Little Mill Rd Unit 20015621
- 0 NE Little Mill Rd Unit 7615982
- 0 NE Little Mill Rd Unit 8328760
- 0 NE Little Mill Rd
- 325 Jackson St
- 275 Jackson St
- 4926 Little Mill Rd
- 4980 Little Mill Rd