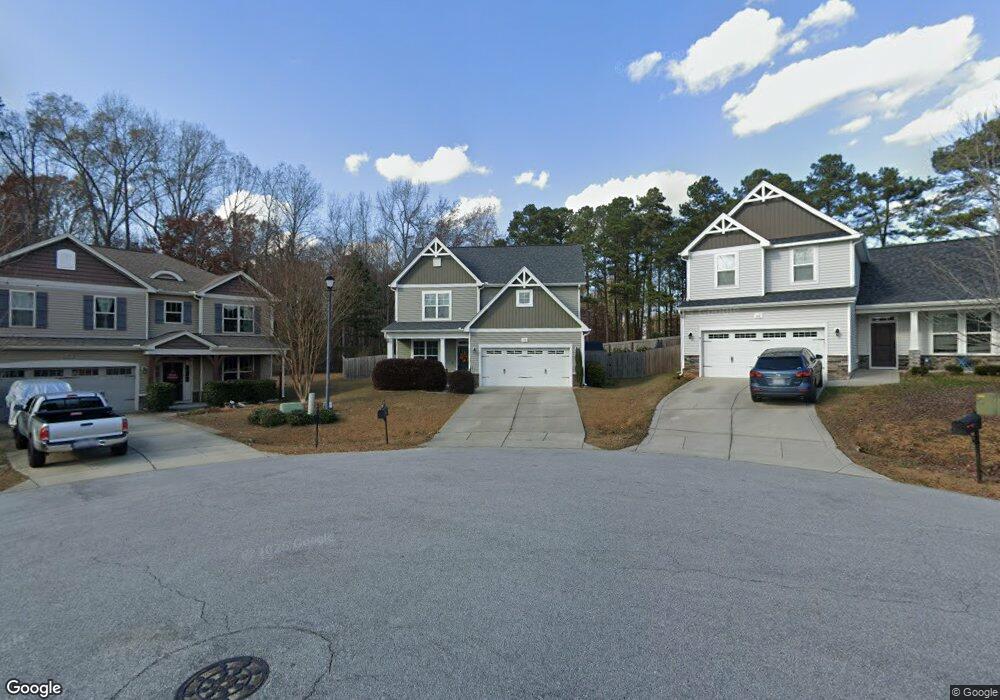
70 Bellefield Ln Unit L43 Clayton, NC 27527
Estimated Value: $378,189 - $416,000
4
Beds
3
Baths
2,378
Sq Ft
$169/Sq Ft
Est. Value
About This Home
This home is located at 70 Bellefield Ln Unit L43, Clayton, NC 27527 and is currently estimated at $400,797, approximately $168 per square foot. 70 Bellefield Ln Unit L43 is a home located in Johnston County with nearby schools including Powhatan Elementary School, Riverwood Middle School, and Clayton High.
Ownership History
Date
Name
Owned For
Owner Type
Purchase Details
Closed on
Jun 2, 2021
Sold by
Mcnutt Harry G and Mcnutt Heather R
Bought by
Cela Artenida
Current Estimated Value
Home Financials for this Owner
Home Financials are based on the most recent Mortgage that was taken out on this home.
Original Mortgage
$264,000
Outstanding Balance
$239,019
Interest Rate
2.9%
Mortgage Type
New Conventional
Estimated Equity
$161,778
Purchase Details
Closed on
Apr 24, 2013
Sold by
H & H Homes Of Fayetteville Llc
Bought by
Mcnutt Harry G and Mcnutt Heather R
Home Financials for this Owner
Home Financials are based on the most recent Mortgage that was taken out on this home.
Original Mortgage
$189,000
Interest Rate
3.59%
Mortgage Type
VA
Purchase Details
Closed on
Feb 23, 2012
Sold by
Granite Land & Timber Llc
Bought by
H & H Homes Of Fayetteville Llc
Create a Home Valuation Report for This Property
The Home Valuation Report is an in-depth analysis detailing your home's value as well as a comparison with similar homes in the area
Home Values in the Area
Average Home Value in this Area
Purchase History
| Date | Buyer | Sale Price | Title Company |
|---|---|---|---|
| Cela Artenida | $344,000 | None Available | |
| Mcnutt Harry G | $189,000 | None Available | |
| H & H Homes Of Fayetteville Llc | $124,000 | None Available |
Source: Public Records
Mortgage History
| Date | Status | Borrower | Loan Amount |
|---|---|---|---|
| Open | Cela Artenida | $264,000 | |
| Previous Owner | Mcnutt Harry G | $189,000 |
Source: Public Records
Tax History
| Year | Tax Paid | Tax Assessment Tax Assessment Total Assessment is a certain percentage of the fair market value that is determined by local assessors to be the total taxable value of land and additions on the property. | Land | Improvement |
|---|---|---|---|---|
| 2025 | $3,850 | $381,200 | $55,000 | $326,200 |
| 2024 | $3,359 | $254,480 | $40,000 | $214,480 |
| 2023 | $3,283 | $254,480 | $40,000 | $214,480 |
| 2022 | $3,385 | $254,480 | $40,000 | $214,480 |
| 2021 | $3,138 | $239,560 | $40,000 | $199,560 |
| 2020 | $3,210 | $239,560 | $40,000 | $199,560 |
| 2019 | $3,210 | $239,560 | $40,000 | $199,560 |
| 2018 | $2,565 | $188,610 | $40,000 | $148,610 |
| 2017 | $2,509 | $188,610 | $40,000 | $148,610 |
| 2016 | $2,509 | $188,610 | $40,000 | $148,610 |
| 2015 | $2,461 | $188,610 | $40,000 | $148,610 |
| 2014 | $2,461 | $188,610 | $40,000 | $148,610 |
Source: Public Records
Map
Nearby Homes
- 110 Green Willows Dr
- 33 W Smoketree Ct Unit W
- 38 Standing Oaks Ln
- 118 Hemlock Green Ln
- 133 Beaufort Loop
- 15 Duplin Ln
- 19 Onslow Dr
- 6 Cabarrus Way
- 33 Davidson St
- 38 Cabarrus Way
- 412 Black Forest Dr
- 17 Edinburgh Place
- 397 Sugarberry Ln
- 106 Muirfield Ln
- 9439 Clayton Blvd
- 821 Glen Laurel Rd
- 4800 U S 70 Business
- 901 Birkdale Dr
- 66 Blue Iris Pkwy
- 27 Pansy Park
- 70 Bellefield Ln
- 74 Bellefield Ln Unit L44
- 62 Bellefield Ln
- 75 Bellefield Ln Unit L45
- 75 Bellefield Ln
- 52 Bellefield Ln
- 67 Bellefield Ln
- 36 Bellefield Ln
- 41 Bellefield Ln
- 41 Bellefield Ln Unit L47
- 41 Bellefield Ln
- 28 Bellefield Ln
- 13 Bellefield Ln
- 194 Rolling Meadows Dr
- 16 Bellefield Ln
- 189 Rolling Meadows Dr Unit L140
- 189 Rolling Meadows Dr
- 190 Rolling Meadows Dr
- 173 Rolling Meadows Dr Unit L141
- 173 Rolling Meadows Dr
Your Personal Tour Guide
Ask me questions while you tour the home.