70 Bennett St Gilroy, CA 95020
Las Animas NeighborhoodEstimated Value: $686,000 - $948,000
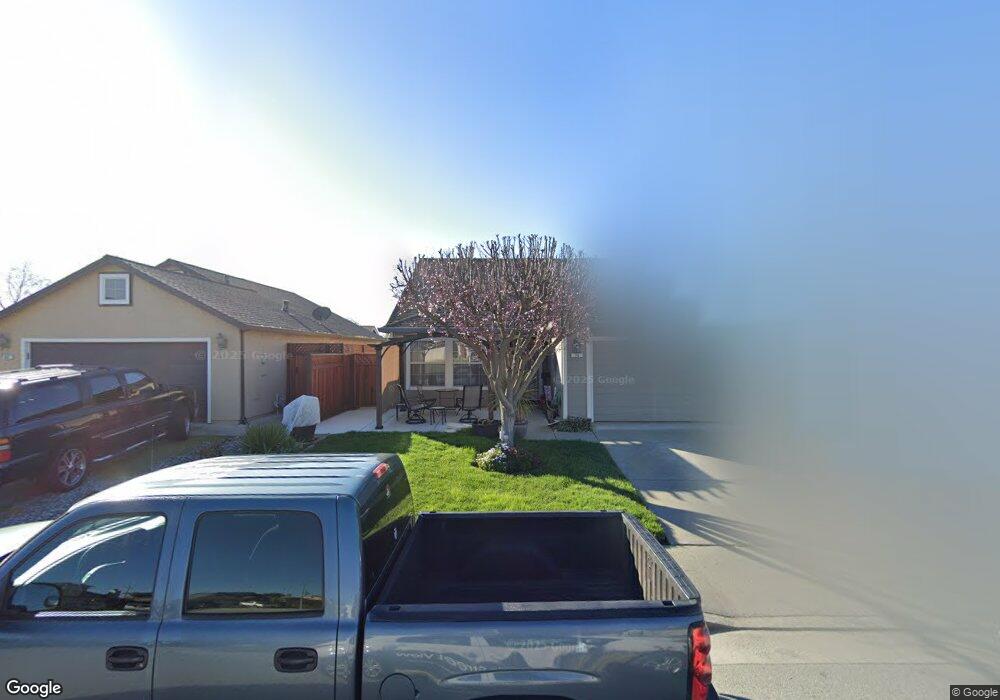
About This Home
This home is located at 70 Bennett St, Gilroy, CA 95020 and is currently estimated at $832,233, approximately $573 per square foot. 70 Bennett St is a home located in Santa Clara County with nearby schools including South Valley Middle School, Solorsano Middle School, and Christopher High School.
Ownership History
We collect this data history from publicly available records. To have your information removed, we recommend requesting removal directly through your county’s website.
Purchase Details
Home Values in the Area
Average Home Value in this Area
Purchase History
We collect this data history from publicly available records. To have your information removed, we recommend requesting removal directly through your county’s website.
| Date | Buyer | Sale Price | Title Company |
|---|---|---|---|
| $188,500 | Old Republic Title Company | ||
| -- | Old Republic Title Company |
Mortgage History
We collect this data history from publicly available records. To have your information removed, we recommend requesting removal directly through your county’s website.
| Date | Status | Borrower | Loan Amount |
|---|---|---|---|
| Open | $135,985 | ||
| Closed | $25,000 | ||
| Closed | $153,000 |
Tax History
We collect this data history from publicly available records. To have your information removed, we recommend requesting removal directly through your county’s website.
| Year | Tax Paid | Tax Assessment Tax Assessment Total Assessment is a certain percentage of the fair market value that is determined by local assessors to be the total taxable value of land and additions on the property. | Land | Improvement |
|---|---|---|---|---|
| 2026 | $3,265 | $268,623 | $97,705 | $170,918 |
| 2025 | $3,212 | $263,357 | $95,790 | $167,567 |
| 2024 | $3,212 | $258,194 | $93,912 | $164,282 |
| 2023 | $3,191 | $253,132 | $92,071 | $161,061 |
| 2022 | $3,136 | $248,169 | $90,266 | $157,903 |
| 2021 | $3,118 | $243,304 | $88,497 | $154,807 |
| 2020 | $3,083 | $240,810 | $87,590 | $153,220 |
| 2019 | $3,054 | $236,089 | $85,873 | $150,216 |
| 2018 | $2,854 | $231,461 | $84,190 | $147,271 |
| 2017 | $2,909 | $226,924 | $82,540 | $144,384 |
| 2016 | $2,842 | $222,475 | $80,922 | $141,553 |
| 2015 | $2,683 | $250,420 | $92,992 | $157,428 |
| 2014 | $3,042 | $245,516 | $91,171 | $154,345 |
Map
- 45 Canterbury Place
- 119 Farrell Ave
- 103 Farrell Ave
- 111 Farrell Ave
- 118 Chickadee Ln
- 9391 Church St
- 154 Sandpiper Way
- 500 Ronan Ave
- 641 Eden St
- 283 Windsong Way
- 500 Birdsong St
- 9192 Wickham Ct
- 700 Las Animas Ave
- 735 Painter Ct
- 8431 Wayland Ln
- 3065 Pacheco Pass Hwy
- 2021 Portmarnock Way
- 2005 Hecker Pass Hwy
- 0000 Hecker Pass
- 9555 Santa Teresa Blvd
Ask me questions while you tour the home.