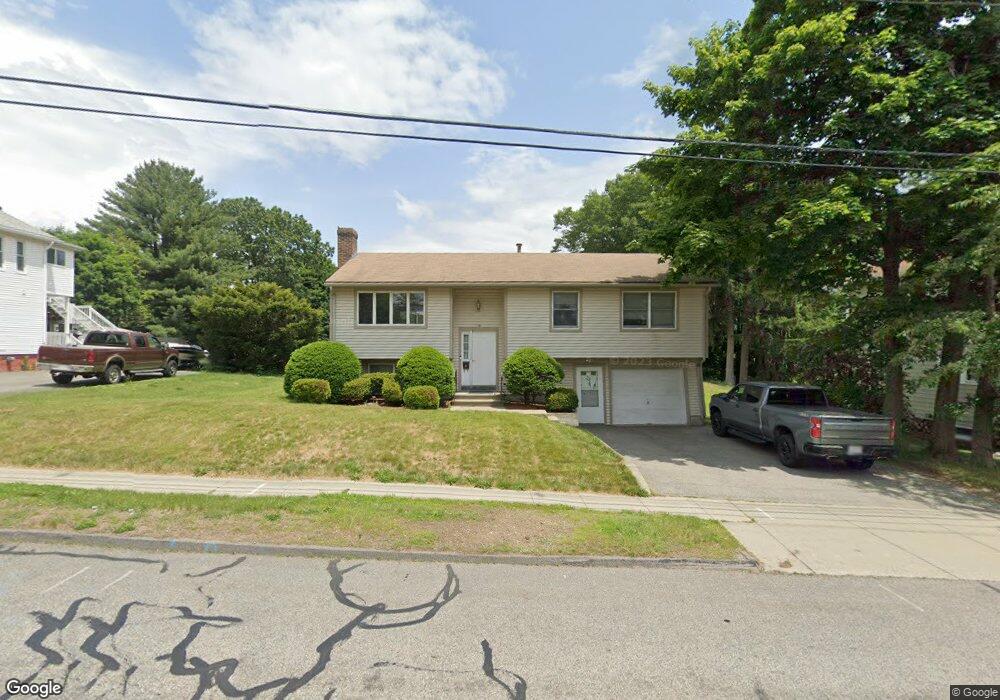
70 Beverly Rd Worcester, MA 01605
North Lincoln Street NeighborhoodEstimated Value: $443,473 - $493,000
3
Beds
3
Baths
1,132
Sq Ft
$412/Sq Ft
Est. Value
About This Home
This home is located at 70 Beverly Rd, Worcester, MA 01605 and is currently estimated at $466,868, approximately $412 per square foot. 70 Beverly Rd is a home located in Worcester County with nearby schools including Jacob Hiatt Magnet School, Chandler Magnet, and Thorndyke Road School.
Ownership History
Date
Name
Owned For
Owner Type
Purchase Details
Closed on
Jun 28, 1991
Sold by
Khaund Arup K and Khaund Neeta
Bought by
Padilla Carlos H and Padilla Marina
Current Estimated Value
Home Financials for this Owner
Home Financials are based on the most recent Mortgage that was taken out on this home.
Original Mortgage
$108,000
Interest Rate
9.44%
Mortgage Type
Purchase Money Mortgage
Create a Home Valuation Report for This Property
The Home Valuation Report is an in-depth analysis detailing your home's value as well as a comparison with similar homes in the area
Home Values in the Area
Average Home Value in this Area
Purchase History
| Date | Buyer | Sale Price | Title Company |
|---|---|---|---|
| Padilla Carlos H | $120,000 | -- |
Source: Public Records
Mortgage History
| Date | Status | Borrower | Loan Amount |
|---|---|---|---|
| Closed | Padilla Carlos H | $108,000 | |
| Previous Owner | Padilla Carlos H | $22,000 |
Source: Public Records
Tax History
| Year | Tax Paid | Tax Assessment Tax Assessment Total Assessment is a certain percentage of the fair market value that is determined by local assessors to be the total taxable value of land and additions on the property. | Land | Improvement |
|---|---|---|---|---|
| 2025 | $5,258 | $398,600 | $118,100 | $280,500 |
| 2024 | $5,132 | $373,200 | $118,100 | $255,100 |
| 2023 | $4,996 | $348,400 | $102,700 | $245,700 |
| 2022 | $4,336 | $285,100 | $82,200 | $202,900 |
| 2021 | $4,160 | $255,500 | $65,700 | $189,800 |
| 2020 | $4,061 | $238,900 | $65,700 | $173,200 |
| 2019 | $3,964 | $220,200 | $59,200 | $161,000 |
| 2018 | $3,996 | $211,300 | $59,200 | $152,100 |
| 2017 | $3,838 | $199,700 | $59,200 | $140,500 |
| 2016 | $3,763 | $182,600 | $43,200 | $139,400 |
| 2015 | $3,665 | $182,600 | $43,200 | $139,400 |
| 2014 | $3,568 | $182,600 | $43,200 | $139,400 |
Source: Public Records
Map
Nearby Homes
- 45 Goldthwaite Rd
- 30 Melrose St
- 2 Selden St
- 3205 Halcyon Dr Unit 3205
- 17 Goucher Ave
- 22 Huron Ave
- 12 Erie Ave
- 33 Denmark St
- 58 Osceola Ave
- 25 Mckinley Rd
- 169 Whitmarsh Ave
- 15 Ericsson St
- 55 Clark St
- 655 Plantation St Unit 20B
- 323 Burncoat St
- 27 Harlow St
- 331 Burncoat St
- 65 Paine St
- 82 Green Hill Pkwy
- 78 Green Hill Pkwy
Your Personal Tour Guide
Ask me questions while you tour the home.