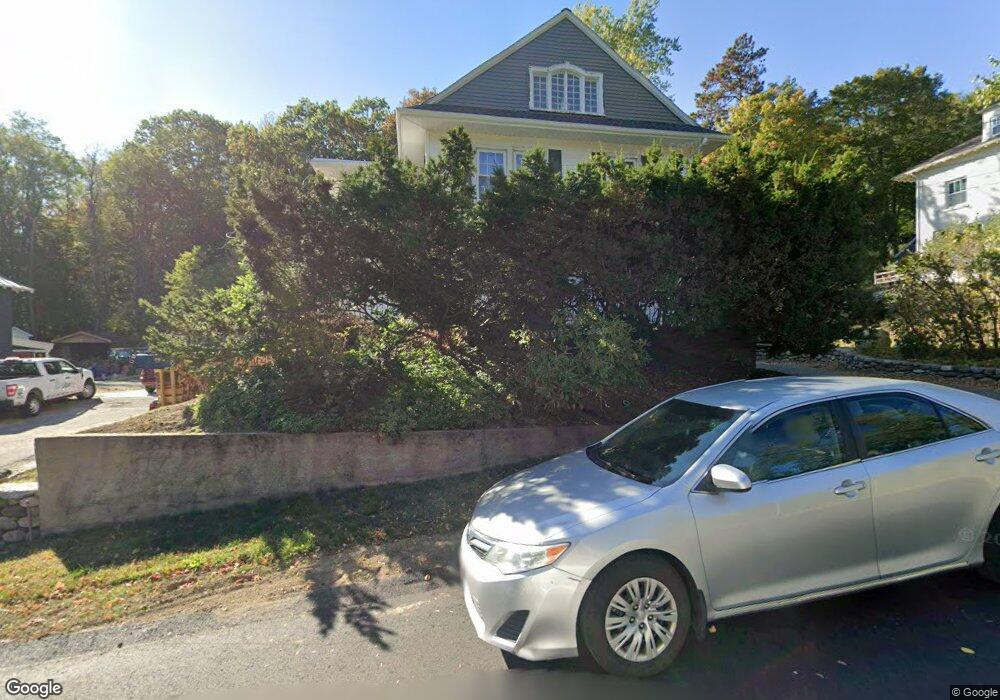
70 Bond St Fitchburg, MA 01420
Estimated Value: $481,000 - $534,000
5
Beds
2
Baths
2,538
Sq Ft
$198/Sq Ft
Est. Value
About This Home
This home is located at 70 Bond St, Fitchburg, MA 01420 and is currently estimated at $501,408, approximately $197 per square foot. 70 Bond St is a home located in Worcester County with nearby schools including Crocker Elementary School, South Street Elementary School, and Reingold Elementary School.
Ownership History
Date
Name
Owned For
Owner Type
Purchase Details
Closed on
Jul 13, 2022
Sold by
Sandrelli Lisa and Sandrelli David
Bought by
Sandrelli Brianna M and Peterson Tucker L
Current Estimated Value
Home Financials for this Owner
Home Financials are based on the most recent Mortgage that was taken out on this home.
Original Mortgage
$220,000
Outstanding Balance
$196,962
Interest Rate
5.09%
Mortgage Type
New Conventional
Estimated Equity
$304,446
Purchase Details
Closed on
Oct 15, 2018
Sold by
Niemi Beatrice N and Sha Gail W
Bought by
Sandrelli Lisa and Sandrelli David
Purchase Details
Closed on
Aug 7, 2013
Sold by
Niemi Beatrice N
Bought by
Shaw Gail and Niemi Beatrice N
Purchase Details
Closed on
May 4, 1971
Bought by
Niemi Beatrice N and Shaw Gail
Create a Home Valuation Report for This Property
The Home Valuation Report is an in-depth analysis detailing your home's value as well as a comparison with similar homes in the area
Home Values in the Area
Average Home Value in this Area
Purchase History
| Date | Buyer | Sale Price | Title Company |
|---|---|---|---|
| Sandrelli Brianna M | -- | None Available | |
| Sandrelli Brianna M | -- | None Available | |
| Sandrelli Lisa | $200,000 | -- | |
| Shaw Gail | -- | -- | |
| Niemi Beatrice N | -- | -- | |
| Shaw Gail | -- | -- |
Source: Public Records
Mortgage History
| Date | Status | Borrower | Loan Amount |
|---|---|---|---|
| Open | Sandrelli Brianna M | $220,000 | |
| Closed | Sandrelli Brianna M | $220,000 |
Source: Public Records
Tax History Compared to Growth
Tax History
| Year | Tax Paid | Tax Assessment Tax Assessment Total Assessment is a certain percentage of the fair market value that is determined by local assessors to be the total taxable value of land and additions on the property. | Land | Improvement |
|---|---|---|---|---|
| 2025 | $65 | $481,400 | $109,600 | $371,800 |
| 2024 | $6,343 | $428,300 | $63,100 | $365,200 |
| 2023 | $6,238 | $389,400 | $54,400 | $335,000 |
| 2022 | $6,038 | $342,900 | $49,500 | $293,400 |
| 2021 | $6,025 | $316,600 | $47,000 | $269,600 |
| 2020 | $5,852 | $296,900 | $44,500 | $252,400 |
| 2019 | $5,612 | $273,900 | $58,200 | $215,700 |
| 2018 | $5,463 | $260,000 | $56,900 | $203,100 |
| 2017 | $5,119 | $238,200 | $54,400 | $183,800 |
| 2016 | $4,881 | $229,900 | $53,200 | $176,700 |
| 2015 | $4,692 | $226,900 | $54,400 | $172,500 |
| 2014 | $4,484 | $226,100 | $54,400 | $171,700 |
Source: Public Records
Map
Nearby Homes
- 59 Arlington St
- 47 Arlington St
- 58 Arlington St Unit 60
- 39 Arlington St
- 151 Mechanic St
- 90 Mechanic St
- 13-15 Chestnut St
- 33-35 Omena Place
- 205-207 High St
- 68 Marshall St
- 195 Marshall St
- 7 Valleyview Ct Unit 3
- 62 Grove St
- 230 Kimball St
- 5 Jay St
- 58 Oliver St
- 11 Beech Street Ln
- 34 Garnet St
- 58 (A B) Oliver St
- 79 Beech St