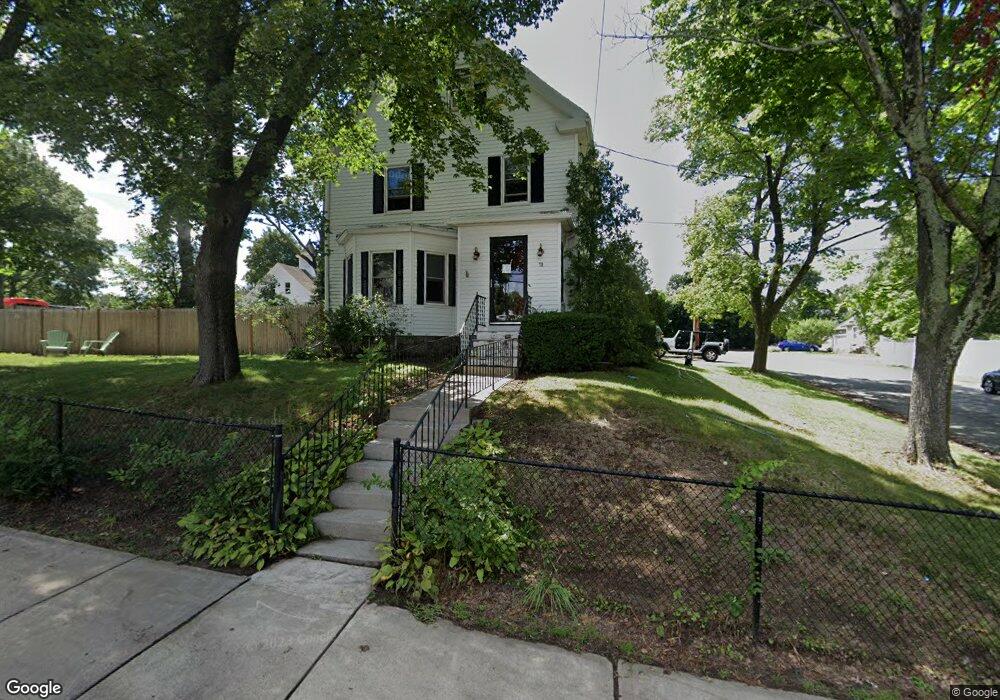
70 Bow St Woburn, MA 01801
Downtown Woburn NeighborhoodEstimated Value: $794,452 - $910,000
3
Beds
2
Baths
1,883
Sq Ft
$451/Sq Ft
Est. Value
About This Home
This home is located at 70 Bow St, Woburn, MA 01801 and is currently estimated at $848,613, approximately $450 per square foot. 70 Bow St is a home located in Middlesex County with nearby schools including Malcolm White Elementary School, John F. Kennedy Middle School, and Woburn High School.
Ownership History
Date
Name
Owned For
Owner Type
Purchase Details
Closed on
Jul 31, 2003
Sold by
Young Margaret M and Briand Louis P
Bought by
Kelley Sandra and Kelley Sheila A
Current Estimated Value
Home Financials for this Owner
Home Financials are based on the most recent Mortgage that was taken out on this home.
Original Mortgage
$200,000
Outstanding Balance
$85,888
Interest Rate
5.28%
Mortgage Type
Purchase Money Mortgage
Estimated Equity
$762,725
Create a Home Valuation Report for This Property
The Home Valuation Report is an in-depth analysis detailing your home's value as well as a comparison with similar homes in the area
Home Values in the Area
Average Home Value in this Area
Purchase History
| Date | Buyer | Sale Price | Title Company |
|---|---|---|---|
| Kelley Sandra | $365,000 | -- | |
| Kelley Sandra | $365,000 | -- |
Source: Public Records
Mortgage History
| Date | Status | Borrower | Loan Amount |
|---|---|---|---|
| Open | Kelley Sandra | $200,000 | |
| Closed | Kelley Sandra | $200,000 | |
| Previous Owner | Kelley Sandra | $15,000 | |
| Previous Owner | Kelley Sandra | $20,000 |
Source: Public Records
Tax History
| Year | Tax Paid | Tax Assessment Tax Assessment Total Assessment is a certain percentage of the fair market value that is determined by local assessors to be the total taxable value of land and additions on the property. | Land | Improvement |
|---|---|---|---|---|
| 2025 | $5,925 | $693,800 | $328,700 | $365,100 |
| 2024 | $5,267 | $653,500 | $313,000 | $340,500 |
| 2023 | $5,310 | $610,300 | $284,600 | $325,700 |
| 2022 | $5,109 | $547,000 | $247,500 | $299,500 |
| 2021 | $4,687 | $502,400 | $235,700 | $266,700 |
| 2020 | $4,667 | $500,800 | $235,700 | $265,100 |
| 2019 | $4,594 | $483,600 | $224,400 | $259,200 |
| 2018 | $4,312 | $436,000 | $205,900 | $230,100 |
| 2017 | $4,088 | $411,300 | $196,100 | $215,200 |
| 2016 | $3,905 | $388,600 | $183,300 | $205,300 |
| 2015 | $3,762 | $369,900 | $171,300 | $198,600 |
| 2014 | $3,655 | $350,100 | $171,300 | $178,800 |
Source: Public Records
Map
Nearby Homes
- 21 Eastern Ave
- 18 Church St Unit 2
- 14 Church Ave
- 555 Main St Unit 11
- 477 Main St
- 39 Jefferson Ave
- 0 Fryeburg Rd
- 31 Montvale Ave Unit 2
- 35 Montvale Ave Unit 8
- 7 Prospect St
- 166 Place Ln Unit 166
- 380 Place Ln
- 16 Felton St
- 26 Flagg St
- 3 Golden Terrace
- 6 Highland St
- 0 Mount Pleasant St
- 31 Tremont St
- 52 Pleasant St
- 80 N Warren St Unit 30
Your Personal Tour Guide
Ask me questions while you tour the home.