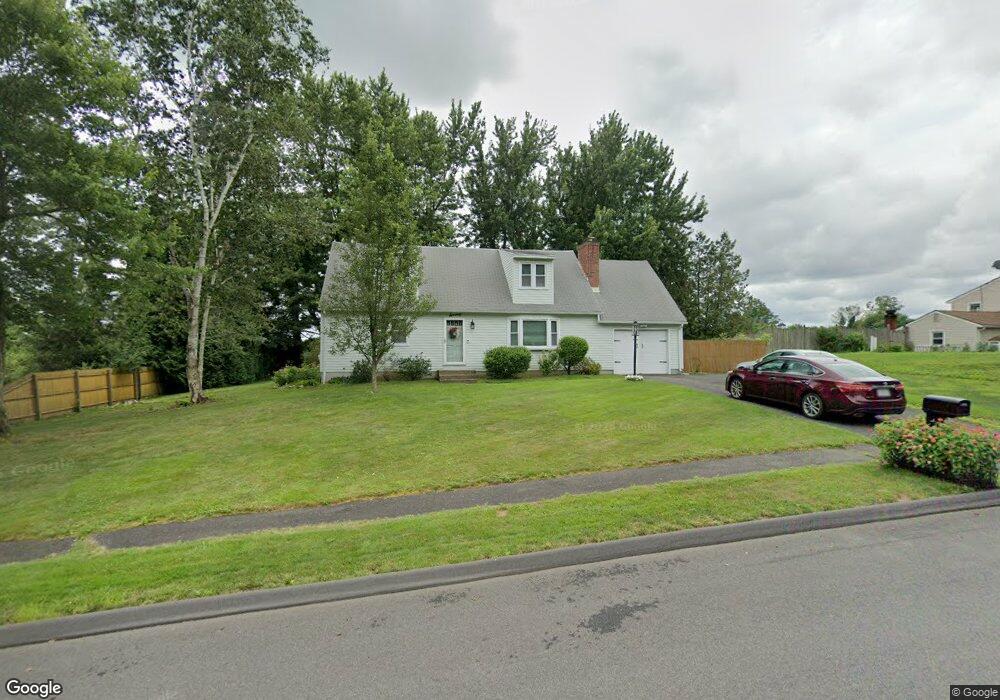
70 Bradford Dr Feeding Hills, MA 01030
Estimated Value: $362,257 - $437,000
4
Beds
2
Baths
1,680
Sq Ft
$234/Sq Ft
Est. Value
About This Home
This home is located at 70 Bradford Dr, Feeding Hills, MA 01030 and is currently estimated at $393,564, approximately $234 per square foot. 70 Bradford Dr is a home located in Hampden County with nearby schools including Agawam Junior High School and Agawam High School.
Ownership History
Date
Name
Owned For
Owner Type
Purchase Details
Closed on
Sep 30, 1994
Sold by
Oneill David B and Oneill Elizabeth A
Bought by
Ranstrom Barry J and Ranstrom Rosemary
Current Estimated Value
Home Financials for this Owner
Home Financials are based on the most recent Mortgage that was taken out on this home.
Original Mortgage
$119,700
Interest Rate
8.5%
Mortgage Type
Purchase Money Mortgage
Create a Home Valuation Report for This Property
The Home Valuation Report is an in-depth analysis detailing your home's value as well as a comparison with similar homes in the area
Home Values in the Area
Average Home Value in this Area
Purchase History
| Date | Buyer | Sale Price | Title Company |
|---|---|---|---|
| Ranstrom Barry J | $133,000 | -- |
Source: Public Records
Mortgage History
| Date | Status | Borrower | Loan Amount |
|---|---|---|---|
| Closed | Ranstrom Barry J | $119,700 | |
| Previous Owner | Ranstrom Barry J | $94,500 |
Source: Public Records
Tax History Compared to Growth
Tax History
| Year | Tax Paid | Tax Assessment Tax Assessment Total Assessment is a certain percentage of the fair market value that is determined by local assessors to be the total taxable value of land and additions on the property. | Land | Improvement |
|---|---|---|---|---|
| 2025 | $4,294 | $293,300 | $106,300 | $187,000 |
| 2024 | $4,199 | $288,800 | $106,300 | $182,500 |
| 2023 | $3,634 | $230,300 | $92,000 | $138,300 |
| 2022 | $3,489 | $216,600 | $92,000 | $124,600 |
| 2021 | $3,340 | $198,800 | $79,300 | $119,500 |
| 2020 | $3,253 | $193,300 | $78,200 | $115,100 |
| 2019 | $3,154 | $189,400 | $76,600 | $112,800 |
| 2018 | $3,016 | $181,600 | $76,600 | $105,000 |
| 2017 | $2,877 | $176,400 | $76,600 | $99,800 |
| 2016 | $2,785 | $172,100 | $76,600 | $95,500 |
| 2015 | $2,699 | $171,500 | $76,600 | $94,900 |
Source: Public Records
Map
Nearby Homes
- 141 Barry St
- 215 Barry St
- 511 Shoemaker Ln
- 50 Muriel Ln
- 82 Dogwood Ln
- 92 Dogwood Ln
- 0 Hickory St Unit 24099336
- 36-38 Orlando St
- 128 Brookfield Ln
- 441 Silver St
- 48 Cosgrove Ave
- Lot 54 North St
- 122 Southwick St
- 7 Rising Corner Rd
- 691 Mill St
- 387 Southwick St
- 47 Butternut Dr
- 7 Agnoli Place
- 25 Castle Hill Rd Unit E
- 134 Mallard Cir