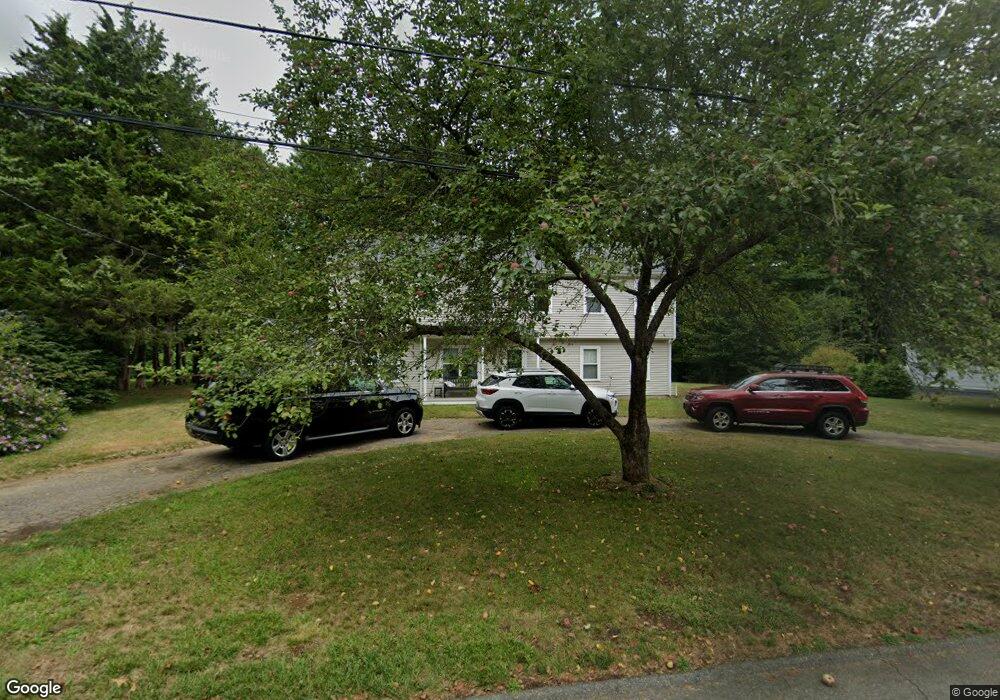
70 Brook Cir Hanover, MA 02339
Estimated Value: $527,000 - $878,000
3
Beds
2
Baths
2,448
Sq Ft
$296/Sq Ft
Est. Value
About This Home
This home is located at 70 Brook Cir, Hanover, MA 02339 and is currently estimated at $724,151, approximately $295 per square foot. 70 Brook Cir is a home located in Plymouth County with nearby schools including Hanover High School and Calvary Chapel Academy.
Ownership History
Date
Name
Owned For
Owner Type
Purchase Details
Closed on
Apr 4, 2016
Sold by
Lloyd Derek R and Lloyd Elizabeth A
Bought by
Lloyd Derek R and Lloyd Lisa
Current Estimated Value
Purchase Details
Closed on
Jun 24, 1993
Sold by
Lenaghan Brian M and Lenaghan Michelle M
Bought by
Lloyd Derek R and Lloyd Elizabeth A
Home Financials for this Owner
Home Financials are based on the most recent Mortgage that was taken out on this home.
Original Mortgage
$97,800
Interest Rate
7.37%
Mortgage Type
Purchase Money Mortgage
Purchase Details
Closed on
Mar 30, 1990
Sold by
Rideout [Mary R
Bought by
Lenaghan Brian M
Purchase Details
Closed on
Aug 31, 1988
Sold by
Murphy Francis T
Bought by
Rideout Mary R
Create a Home Valuation Report for This Property
The Home Valuation Report is an in-depth analysis detailing your home's value as well as a comparison with similar homes in the area
Home Values in the Area
Average Home Value in this Area
Purchase History
| Date | Buyer | Sale Price | Title Company |
|---|---|---|---|
| Lloyd Derek R | -- | -- | |
| Lloyd Derek R | -- | -- | |
| Lloyd Derek R | $122,250 | -- | |
| Lloyd Derek R | $122,250 | -- | |
| Lenaghan Brian M | $135,000 | -- | |
| Lenaghan Brian M | $135,000 | -- | |
| Rideout Mary R | $138,000 | -- |
Source: Public Records
Mortgage History
| Date | Status | Borrower | Loan Amount |
|---|---|---|---|
| Previous Owner | Rideout Mary R | $100,000 | |
| Previous Owner | Rideout Mary R | $135,000 | |
| Previous Owner | Rideout Mary R | $97,800 |
Source: Public Records
Tax History
| Year | Tax Paid | Tax Assessment Tax Assessment Total Assessment is a certain percentage of the fair market value that is determined by local assessors to be the total taxable value of land and additions on the property. | Land | Improvement |
|---|---|---|---|---|
| 2025 | $7,710 | $624,300 | $210,300 | $414,000 |
| 2024 | $7,496 | $583,800 | $210,300 | $373,500 |
| 2023 | $6,991 | $518,200 | $191,300 | $326,900 |
| 2022 | $7,200 | $472,100 | $215,200 | $256,900 |
| 2021 | $6,898 | $422,400 | $184,800 | $237,600 |
| 2020 | $6,539 | $400,900 | $173,900 | $227,000 |
| 2019 | $5,977 | $364,200 | $152,200 | $212,000 |
| 2018 | $4,520 | $353,600 | $169,600 | $184,000 |
| 2017 | $4,303 | $260,500 | $158,100 | $102,400 |
| 2016 | $4,392 | $260,500 | $158,100 | $102,400 |
| 2015 | $4,005 | $248,000 | $158,100 | $89,900 |
Source: Public Records
Map
Nearby Homes
Your Personal Tour Guide
Ask me questions while you tour the home.