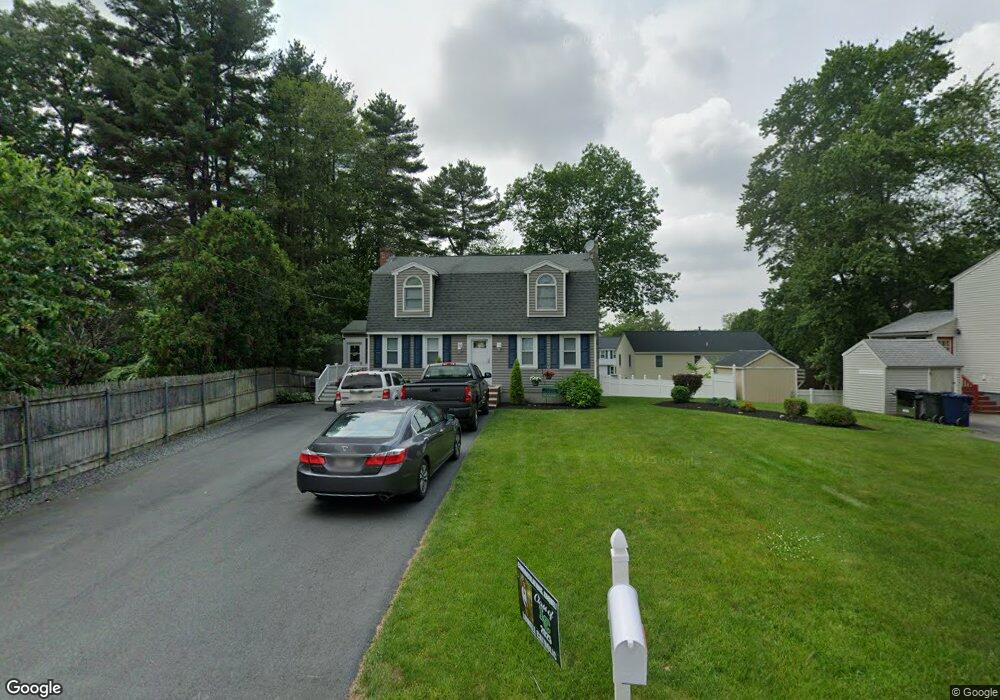
70 C St Dracut, MA 01826
Estimated Value: $551,000 - $585,000
4
Beds
2
Baths
1,600
Sq Ft
$351/Sq Ft
Est. Value
About This Home
This home is located at 70 C St, Dracut, MA 01826 and is currently estimated at $561,659, approximately $351 per square foot. 70 C St is a home located in Middlesex County with nearby schools including Brookside Elementary School, Richardson Middle School, and Dracut Senior High School.
Ownership History
Date
Name
Owned For
Owner Type
Purchase Details
Closed on
Oct 23, 2003
Sold by
Carney Laurie A and Carney Sean P
Bought by
Rego Ana P and Rego Tito M
Current Estimated Value
Home Financials for this Owner
Home Financials are based on the most recent Mortgage that was taken out on this home.
Original Mortgage
$278,900
Outstanding Balance
$129,615
Interest Rate
6.15%
Mortgage Type
Purchase Money Mortgage
Estimated Equity
$432,044
Purchase Details
Closed on
Jun 30, 1993
Sold by
Vokey Wayne W and Vokey Mary
Bought by
Carney Sean P and Carney Laurie
Home Financials for this Owner
Home Financials are based on the most recent Mortgage that was taken out on this home.
Original Mortgage
$114,750
Interest Rate
7.46%
Mortgage Type
Purchase Money Mortgage
Purchase Details
Closed on
Oct 20, 1989
Sold by
Sykes Thomas
Bought by
Vokey Wayne
Create a Home Valuation Report for This Property
The Home Valuation Report is an in-depth analysis detailing your home's value as well as a comparison with similar homes in the area
Home Values in the Area
Average Home Value in this Area
Purchase History
| Date | Buyer | Sale Price | Title Company |
|---|---|---|---|
| Rego Ana P | $309,900 | -- | |
| Carney Sean P | $127,500 | -- | |
| Vokey Wayne | $147,000 | -- |
Source: Public Records
Mortgage History
| Date | Status | Borrower | Loan Amount |
|---|---|---|---|
| Open | Rego Ana P | $278,900 | |
| Previous Owner | Vokey Wayne | $25,000 | |
| Previous Owner | Vokey Wayne | $114,500 | |
| Previous Owner | Vokey Wayne | $114,750 |
Source: Public Records
Tax History
| Year | Tax Paid | Tax Assessment Tax Assessment Total Assessment is a certain percentage of the fair market value that is determined by local assessors to be the total taxable value of land and additions on the property. | Land | Improvement |
|---|---|---|---|---|
| 2025 | $5,014 | $495,500 | $199,200 | $296,300 |
| 2024 | $4,830 | $462,200 | $189,700 | $272,500 |
| 2023 | $4,784 | $413,100 | $165,000 | $248,100 |
| 2022 | $4,632 | $376,900 | $149,900 | $227,000 |
| 2021 | $4,470 | $343,600 | $136,300 | $207,300 |
| 2020 | $4,332 | $324,500 | $132,300 | $192,200 |
| 2019 | $4,120 | $299,600 | $125,900 | $173,700 |
| 2018 | $8,606 | $292,000 | $125,900 | $166,100 |
| 2017 | $4,102 | $292,000 | $125,900 | $166,100 |
| 2016 | $3,993 | $269,100 | $121,100 | $148,000 |
| 2015 | $3,859 | $258,500 | $121,100 | $137,400 |
| 2014 | $3,614 | $249,400 | $121,100 | $128,300 |
Source: Public Records
Map
Nearby Homes
- 43 & 53 5th St
- 17 Spare St
- 1 Elm Grove Ave
- 29 Mill St Unit B
- 1905 Lakeview Ave
- 70 Faith Ave
- 104 Long Pond Rd
- 13 Dallas Dr Unit 305
- 13 Dallas Dr Unit 107
- 12 Lands-End Rd
- 124 Tennis Plaza Rd Unit 40
- 9 Cornstalk Ln
- 2 Aspen Dr
- 2 Aspen Dr Unit Lot 146-17
- 53 Vinal St
- 94 Tennis Plaza Rd Unit 10
- 4 Mascuppic Trail
- 40 Westfall Rd
- 74 Tennis Plaza Rd Unit 34
- 27 Beech St
Your Personal Tour Guide
Ask me questions while you tour the home.