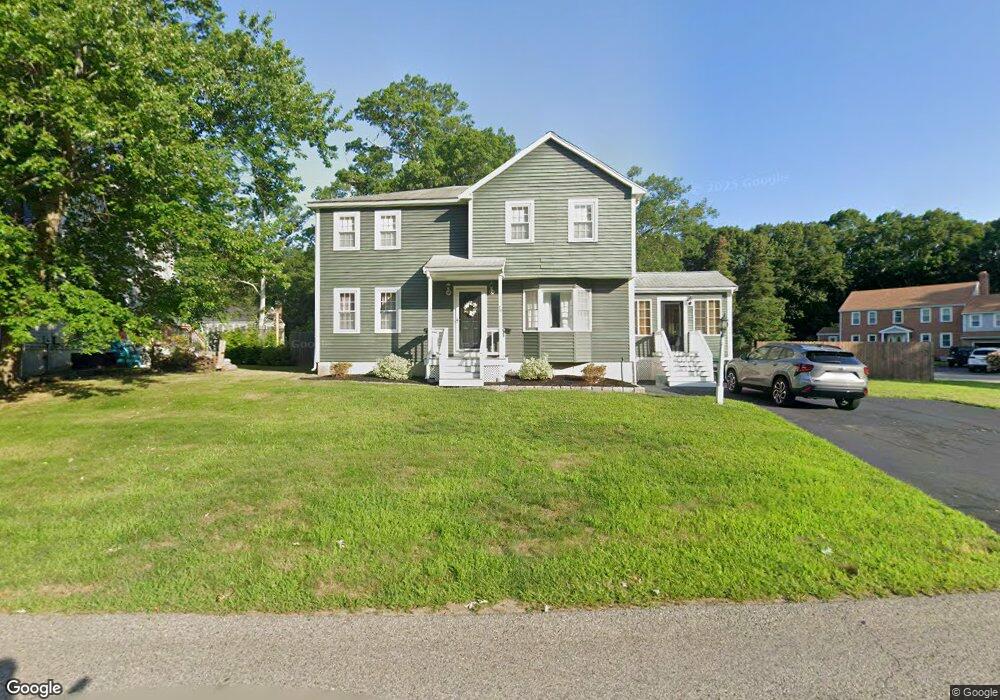
70 Calypso Ln Marshfield, MA 02050
Green Harbor-Cedar Crest NeighborhoodEstimated Value: $682,000 - $802,000
4
Beds
2
Baths
1,752
Sq Ft
$432/Sq Ft
Est. Value
About This Home
This home is located at 70 Calypso Ln, Marshfield, MA 02050 and is currently estimated at $757,435, approximately $432 per square foot. 70 Calypso Ln is a home located in Plymouth County with nearby schools including Governor Edward Winslow School, Furnace Brook Middle School, and Marshfield High School.
Ownership History
Date
Name
Owned For
Owner Type
Purchase Details
Closed on
Oct 31, 2003
Sold by
Gagne Thomas A and Gagne Mary Ann S
Bought by
Manning James C and Manning Christine M
Current Estimated Value
Purchase Details
Closed on
Apr 28, 1995
Sold by
Bent Daniel P and Bent Astrid G
Bought by
Gagne Thomas A and Gagne Mary As
Purchase Details
Closed on
Jun 29, 1989
Sold by
Windjammer Rt
Bought by
Bent Daniel P
Create a Home Valuation Report for This Property
The Home Valuation Report is an in-depth analysis detailing your home's value as well as a comparison with similar homes in the area
Home Values in the Area
Average Home Value in this Area
Purchase History
We collect this data history from publicly available records. To have your information removed, we recommend requesting removal directly through your county’s website.
| Date | Buyer | Sale Price | Title Company |
|---|---|---|---|
| Manning James C | $439,900 | -- | |
| Manning James C | $439,900 | -- | |
| Gagne Thomas A | $186,500 | -- | |
| Gagne Thomas A | $186,500 | -- | |
| Bent Daniel P | $180,000 | -- |
Source: Public Records
Mortgage History
We collect this data history from publicly available records. To have your information removed, we recommend requesting removal directly through your county’s website.
| Date | Status | Borrower | Loan Amount |
|---|---|---|---|
| Open | Bent Daniel P | $33,500 | |
| Closed | Bent Daniel P | $20,000 |
Source: Public Records
Tax History
| Year | Tax Paid | Tax Assessment Tax Assessment Total Assessment is a certain percentage of the fair market value that is determined by local assessors to be the total taxable value of land and additions on the property. | Land | Improvement |
|---|---|---|---|---|
| 2025 | $6,360 | $642,400 | $297,300 | $345,100 |
| 2024 | $6,214 | $598,100 | $283,100 | $315,000 |
| 2023 | $5,777 | $526,700 | $252,800 | $273,900 |
| 2022 | $5,777 | $446,100 | $212,300 | $233,800 |
| 2021 | $5,575 | $422,700 | $212,300 | $210,400 |
| 2020 | $5,288 | $396,700 | $192,100 | $204,600 |
| 2019 | $5,149 | $384,800 | $192,100 | $192,700 |
| 2018 | $5,093 | $380,900 | $192,100 | $188,800 |
| 2017 | $5,057 | $368,600 | $192,100 | $176,500 |
| 2016 | $4,951 | $356,700 | $192,100 | $164,600 |
| 2015 | $4,687 | $352,700 | $192,100 | $160,600 |
| 2014 | $4,626 | $348,100 | $192,100 | $156,000 |
Source: Public Records
Map
Nearby Homes
- 245 Careswell St
- 71 Ice House Ln
- 64 Central St
- 8 Water St
- 71 Webster Ave
- 36 Ocean St
- 585 Careswell St
- 643 Careswell St
- 264 Webster St
- 108 Observatory Waye
- 40 Signal Hill Rd
- 36 Ocean Rd N
- 204 Foster Ave
- 19 Copeland St
- 1221 Ocean St
- 46 Fairways Edge Dr
- 1080 Ocean St
- 1028 Ocean St
- 107 Towne Way
- 555 Webster St
Your Personal Tour Guide
Ask me questions while you tour the home.