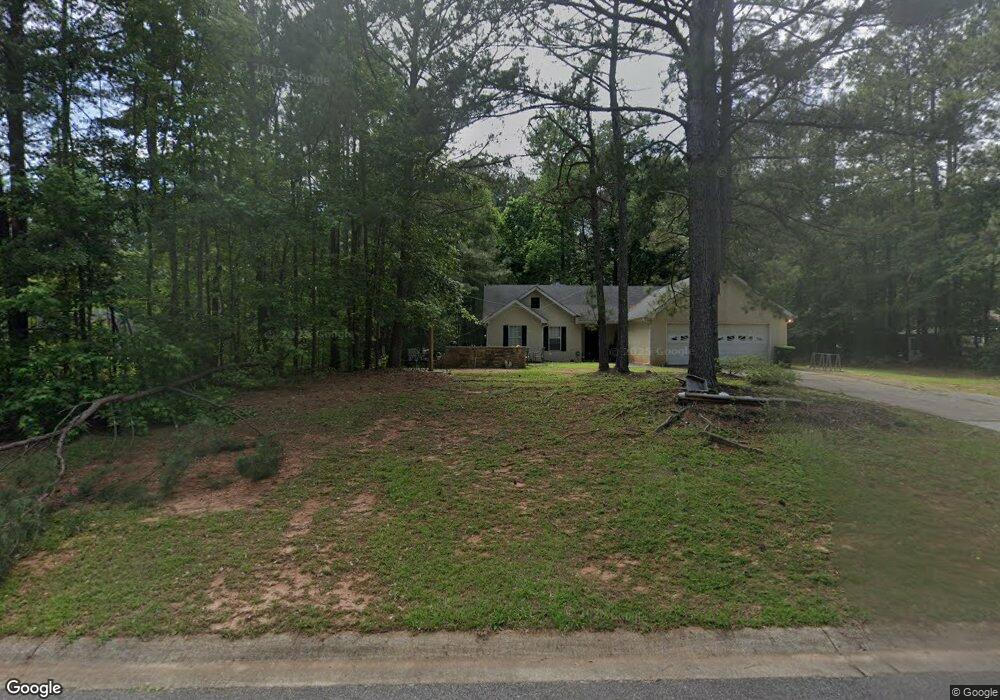
70 Cherish Way Sharpsburg, GA 30277
Estimated Value: $253,644 - $319,000
3
Beds
2
Baths
1,177
Sq Ft
$242/Sq Ft
Est. Value
About This Home
This home is located at 70 Cherish Way, Sharpsburg, GA 30277 and is currently estimated at $285,411, approximately $242 per square foot. 70 Cherish Way is a home located in Coweta County with nearby schools including Poplar Road Elementary School, Lee Middle School, and East Coweta High School.
Ownership History
Date
Name
Owned For
Owner Type
Purchase Details
Closed on
Jun 18, 2001
Sold by
Calderon Pablo A and Calderon Nancy
Bought by
Calderon Douglas C and Calderon Teresa K
Current Estimated Value
Purchase Details
Closed on
Jun 2, 2000
Sold by
Edwards Audrey D
Bought by
Calderon Pablo A and Calderon Nancy
Home Financials for this Owner
Home Financials are based on the most recent Mortgage that was taken out on this home.
Original Mortgage
$77,000
Interest Rate
8.14%
Mortgage Type
New Conventional
Purchase Details
Closed on
Sep 30, 1997
Bought by
Denmon Audrey K
Purchase Details
Closed on
Sep 15, 1997
Bought by
Denmon Audrey K and Denmon Ce
Purchase Details
Closed on
Oct 13, 1995
Sold by
Cosper Homes
Bought by
Snow Timothy Audrey
Purchase Details
Closed on
Jun 7, 1995
Bought by
Rick Cosper Homes In
Purchase Details
Closed on
Nov 15, 1994
Bought by
R C Development Inc
Create a Home Valuation Report for This Property
The Home Valuation Report is an in-depth analysis detailing your home's value as well as a comparison with similar homes in the area
Home Values in the Area
Average Home Value in this Area
Purchase History
| Date | Buyer | Sale Price | Title Company |
|---|---|---|---|
| Calderon Douglas C | -- | -- | |
| Calderon Pablo A | $102,000 | -- | |
| Denmon Audrey K | -- | -- | |
| Denmon Audrey K | -- | -- | |
| Snow Timothy Audrey | $88,900 | -- | |
| Rick Cosper Homes In | $19,100 | -- | |
| R C Development Inc | $390,000 | -- |
Source: Public Records
Mortgage History
| Date | Status | Borrower | Loan Amount |
|---|---|---|---|
| Previous Owner | Calderon Pablo A | $77,000 | |
| Closed | Snow Timothy Audrey | $0 |
Source: Public Records
Tax History Compared to Growth
Tax History
| Year | Tax Paid | Tax Assessment Tax Assessment Total Assessment is a certain percentage of the fair market value that is determined by local assessors to be the total taxable value of land and additions on the property. | Land | Improvement |
|---|---|---|---|---|
| 2025 | $2,203 | $93,239 | $24,000 | $69,239 |
| 2024 | $2,158 | $92,964 | $24,000 | $68,964 |
| 2023 | $2,158 | $81,646 | $20,000 | $61,646 |
| 2022 | $1,849 | $75,059 | $20,000 | $55,059 |
| 2021 | $1,402 | $53,257 | $16,000 | $37,257 |
| 2020 | $1,411 | $53,257 | $16,000 | $37,257 |
| 2019 | $1,511 | $51,627 | $10,000 | $41,627 |
| 2018 | $1,514 | $51,627 | $10,000 | $41,627 |
| 2017 | $1,513 | $51,627 | $10,000 | $41,627 |
| 2016 | $1,495 | $51,627 | $10,000 | $41,627 |
| 2015 | $1,319 | $46,341 | $10,000 | $36,341 |
| 2014 | $1,159 | $42,689 | $8,000 | $34,689 |
Source: Public Records
Map
Nearby Homes
- 140 Halo Trace
- 180 Saint James Place
- 0 Highway 154 Unit 10470800
- 25 Chemin Place
- 25 Lentry Dr
- 250 Bob Smith Rd
- 196 Bob Smith Rd
- 0 Bob Smith Rd Unit 10562838
- 20 Beaver Creek Ln
- 138 Main St
- 21 Lake Park Ct
- 1 Mcintosh Trail
- 8 Chiefs Trail
- 1367 Sharpsburg McCollum Rd
- 270 Sturgess Run
- 68 Winchester Dr
- 296 Mcintosh Trail
- 131 Pecan Lake Dr
- 28 Fawn Ct
- 50 Kay Ct
- 58 Cherish Way
- 80 Cherish Way
- 131 Michaels Crossing
- 57 Cherish Way
- 84 Cherish Way
- 125 Michaels Crossing
- 32 Cherish Way
- 95 Michaels Crossing
- 137 Michaels Crossing
- 79 Cherish Way
- 83 Cherish Way
- 7 Golden Ct
- 20 Golden Ct
- 67 Michaels Crossing
- 95 Tralee Trace
- 100 Tralee Trace
- 15 Golden Ct
- 134 Michaels Crossing
- 40 Golden Ct
- 0 Golden Ct Unit 7513789