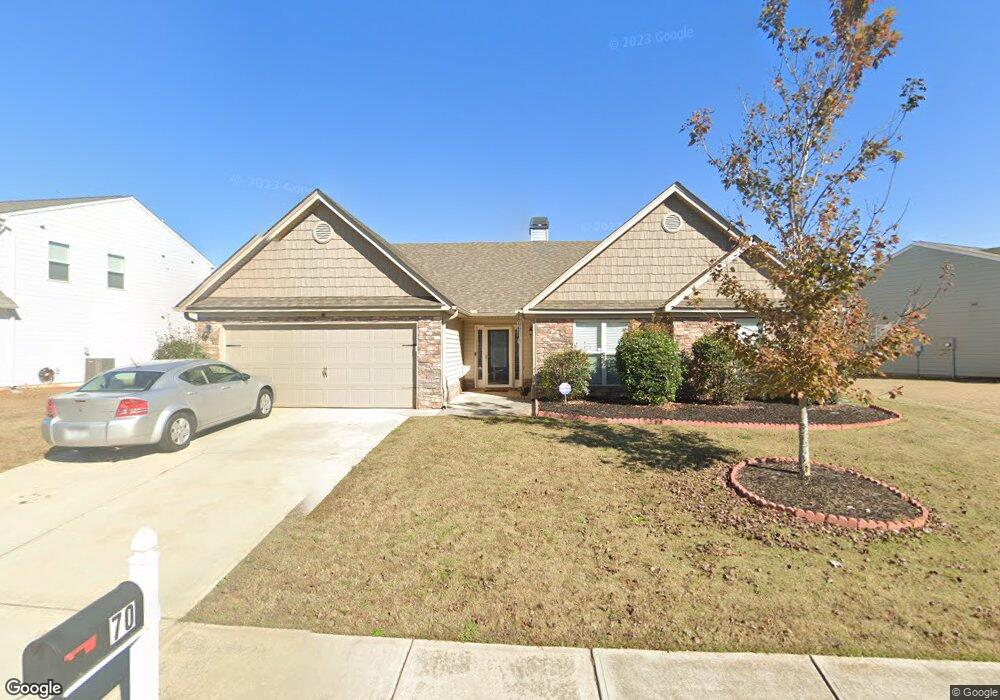
70 Cherohala Ct Unit 109 Covington, GA 30016
Estimated Value: $305,028 - $386,000
4
Beds
3
Baths
2,292
Sq Ft
$146/Sq Ft
Est. Value
About This Home
This home is located at 70 Cherohala Ct Unit 109, Covington, GA 30016 and is currently estimated at $334,507, approximately $145 per square foot. 70 Cherohala Ct Unit 109 is a home located in Newton County with nearby schools including Live Oak Elementary School, Clements Middle School, and Newton High School.
Ownership History
Date
Name
Owned For
Owner Type
Purchase Details
Closed on
Aug 13, 2019
Sold by
Waters Ray
Bought by
Holmes Rosie M
Current Estimated Value
Home Financials for this Owner
Home Financials are based on the most recent Mortgage that was taken out on this home.
Original Mortgage
$206,196
Outstanding Balance
$180,775
Interest Rate
3.75%
Mortgage Type
FHA
Estimated Equity
$153,732
Purchase Details
Closed on
May 31, 2018
Sold by
Tnisha Robinson
Bought by
Waters Ray and Waters Lena
Home Financials for this Owner
Home Financials are based on the most recent Mortgage that was taken out on this home.
Original Mortgage
$193,171
Interest Rate
4.5%
Mortgage Type
VA
Purchase Details
Closed on
Oct 13, 2017
Sold by
Southfork Homes Llc
Bought by
Tnisha Robinson
Home Financials for this Owner
Home Financials are based on the most recent Mortgage that was taken out on this home.
Original Mortgage
$170,905
Interest Rate
3.78%
Mortgage Type
New Conventional
Create a Home Valuation Report for This Property
The Home Valuation Report is an in-depth analysis detailing your home's value as well as a comparison with similar homes in the area
Home Values in the Area
Average Home Value in this Area
Purchase History
| Date | Buyer | Sale Price | Title Company |
|---|---|---|---|
| Holmes Rosie M | $210,000 | -- | |
| Waters Ray | $187,000 | -- | |
| Tnisha Robinson | $179,900 | -- |
Source: Public Records
Mortgage History
| Date | Status | Borrower | Loan Amount |
|---|---|---|---|
| Open | Holmes Rosie M | $206,196 | |
| Previous Owner | Waters Ray | $193,171 | |
| Previous Owner | Tnisha Robinson | $170,905 |
Source: Public Records
Tax History Compared to Growth
Tax History
| Year | Tax Paid | Tax Assessment Tax Assessment Total Assessment is a certain percentage of the fair market value that is determined by local assessors to be the total taxable value of land and additions on the property. | Land | Improvement |
|---|---|---|---|---|
| 2024 | $3,150 | $125,960 | $20,000 | $105,960 |
| 2023 | $3,555 | $132,760 | $9,600 | $123,160 |
| 2022 | $2,860 | $107,160 | $9,600 | $97,560 |
| 2021 | $2,511 | $84,800 | $9,600 | $75,200 |
| 2020 | $2,637 | $78,480 | $9,600 | $68,880 |
| 2019 | $2,319 | $71,880 | $9,600 | $62,280 |
| 2018 | $2,372 | $69,080 | $9,600 | $59,480 |
| 2017 | $198 | $5,760 | $5,760 | $0 |
| 2016 | $157 | $4,560 | $4,560 | $0 |
| 2015 | $133 | $2,280 | $2,280 | $0 |
| 2014 | $113 | $1,680 | $0 | $0 |
Source: Public Records
Map
Nearby Homes
- 70 Cherohala Ct
- 80 Cherohala Ct
- 60 Cherohala Ct
- 85 Bowen Way Unit 105
- 85 Bowen Way
- 95 Bowen Way
- 90 Cherohala Ct Unit 111
- 90 Cherohala Ct
- 40 Cherohala Ct Unit 107
- 40 Cherohala Ct
- 115 Bowen Way
- 85 Cherohala Ct
- 65 Cherohala Ct Unit 129
- 65 Cherohala Ct
- 75 Cherohala Ct
- 10 Cherohala Ct Unit 106
- 10 Cherohala Ct
- 55 Cherohala Ct Unit 130
- 125 Bowen Way
- 100 Cherohala Ct