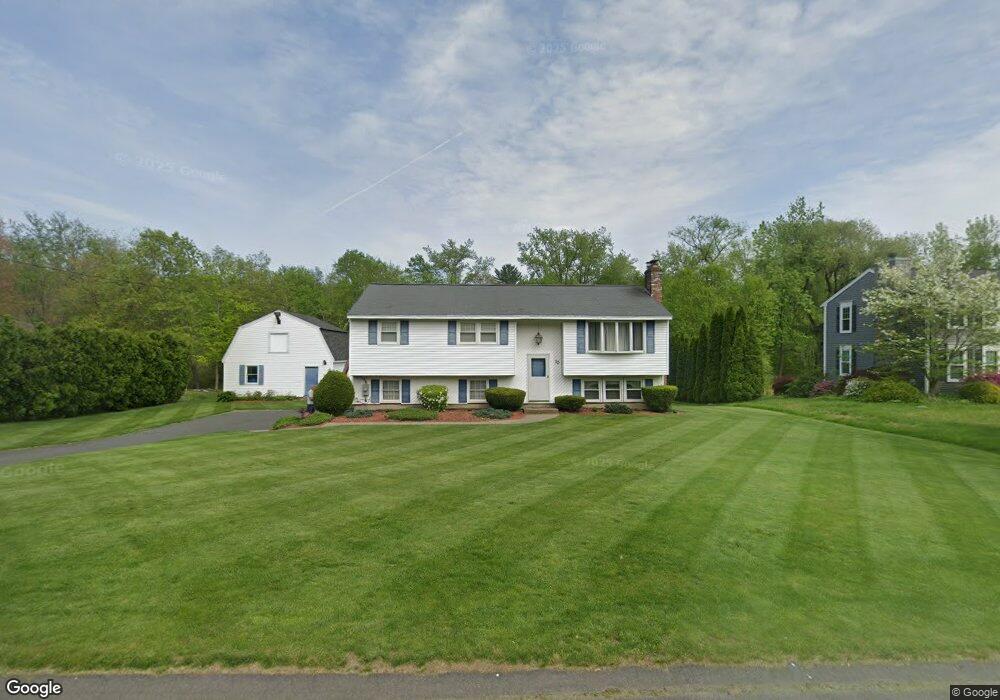
70 Chilson Rd West Springfield, MA 01089
Estimated Value: $371,000 - $463,000
3
Beds
2
Baths
1,132
Sq Ft
$360/Sq Ft
Est. Value
About This Home
This home is located at 70 Chilson Rd, West Springfield, MA 01089 and is currently estimated at $407,161, approximately $359 per square foot. 70 Chilson Rd is a home located in Hampden County with nearby schools including St Thomas The Apostle School.
Ownership History
Date
Name
Owned For
Owner Type
Purchase Details
Closed on
Jul 30, 2024
Sold by
St Onge David A
Bought by
St Onge David A and Lariviere Caryn
Current Estimated Value
Purchase Details
Closed on
Dec 12, 1994
Sold by
Sampson Joseph C
Bought by
Stonge David A and St Onge Debra J
Purchase Details
Closed on
Oct 22, 1993
Sold by
Pepin Robert
Bought by
Sampson Joseph C
Create a Home Valuation Report for This Property
The Home Valuation Report is an in-depth analysis detailing your home's value as well as a comparison with similar homes in the area
Home Values in the Area
Average Home Value in this Area
Purchase History
| Date | Buyer | Sale Price | Title Company |
|---|---|---|---|
| St Onge David A | -- | None Available | |
| St Onge David A | -- | None Available | |
| Stonge David A | $124,000 | -- | |
| Sampson Joseph C | $85,000 | -- | |
| Stonge David A | $124,000 | -- | |
| Sampson Joseph C | $85,000 | -- |
Source: Public Records
Mortgage History
| Date | Status | Borrower | Loan Amount |
|---|---|---|---|
| Previous Owner | Sampson Joseph C | $12,000 | |
| Previous Owner | Sampson Joseph C | $25,000 |
Source: Public Records
Tax History Compared to Growth
Tax History
| Year | Tax Paid | Tax Assessment Tax Assessment Total Assessment is a certain percentage of the fair market value that is determined by local assessors to be the total taxable value of land and additions on the property. | Land | Improvement |
|---|---|---|---|---|
| 2025 | $5,118 | $344,200 | $141,000 | $203,200 |
| 2024 | $5,044 | $340,600 | $141,000 | $199,600 |
| 2023 | $4,667 | $300,300 | $141,000 | $159,300 |
| 2022 | $4,317 | $273,900 | $128,000 | $145,900 |
| 2021 | $4,274 | $252,900 | $122,000 | $130,900 |
| 2020 | $4,297 | $252,900 | $122,000 | $130,900 |
| 2019 | $4,289 | $252,900 | $122,000 | $130,900 |
| 2018 | $4,312 | $252,900 | $122,000 | $130,900 |
| 2017 | $4,312 | $252,900 | $122,000 | $130,900 |
| 2016 | $4,208 | $247,700 | $117,400 | $130,300 |
| 2015 | $4,129 | $243,000 | $115,000 | $128,000 |
| 2014 | $1,003 | $243,000 | $115,000 | $128,000 |
Source: Public Records
Map
Nearby Homes
- 167 Wolcott Ave
- 180 Wolcott Ave
- 260 Wolcott Ave
- 148 Craiwell Ave
- 258 Poplar Ave
- 514 Dewey St
- 43 Houston Rd
- 416 Hillcrest Ave
- 31 Stone Path Ln
- 16 North St
- 283 Forest Glen
- 8 Ridgeview Dr
- 0 E Mountain Rd
- 65 Verdugo St
- 189 Springfield Rd Unit 23
- 142 Morton St
- 0 Feeding Hills Rd
- 103 Feeding Hills Rd
- 719 N West St
- 99 Valley Brook Rd