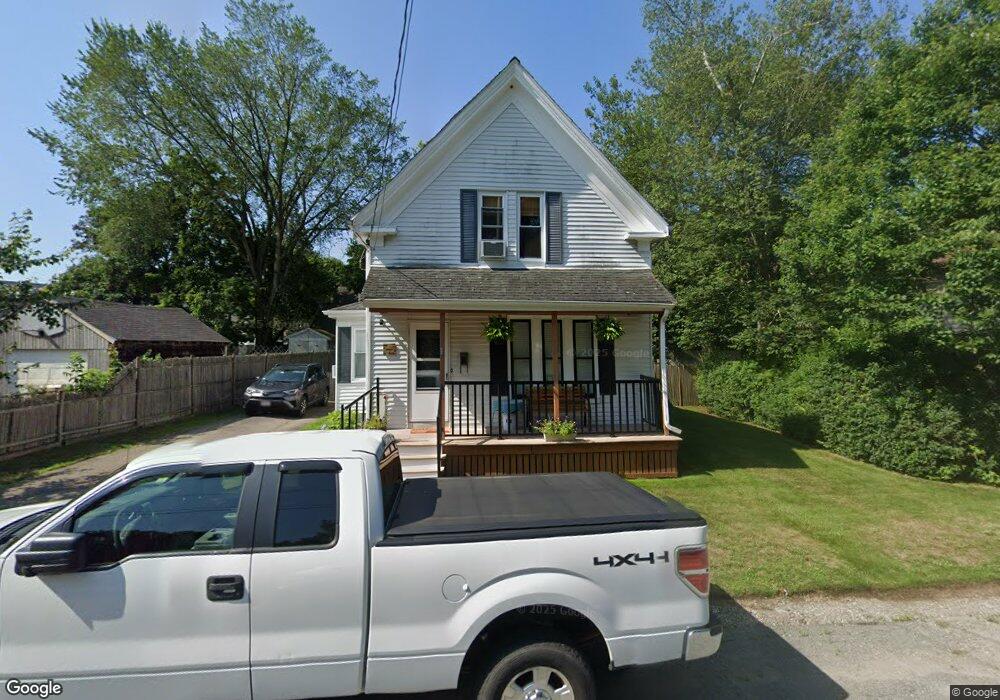
70 Clapp St Stoughton, MA 02072
Estimated Value: $464,000 - $556,000
3
Beds
1
Bath
1,183
Sq Ft
$422/Sq Ft
Est. Value
About This Home
This home is located at 70 Clapp St, Stoughton, MA 02072 and is currently estimated at $499,645, approximately $422 per square foot. 70 Clapp St is a home located in Norfolk County with nearby schools including Wilkins Elementary School, O'Donnell Middle School, and Stoughton High School.
Ownership History
Date
Name
Owned For
Owner Type
Purchase Details
Closed on
Oct 15, 1999
Sold by
Schmidt Walter E and Schmidt Sheila A
Bought by
Martin Brian K
Current Estimated Value
Purchase Details
Closed on
Jan 26, 1996
Sold by
Laporte Tr Felix L
Bought by
Hoeft Sheila A
Purchase Details
Closed on
Jun 18, 1992
Sold by
Laporte Anna H
Bought by
Laporte Felix
Create a Home Valuation Report for This Property
The Home Valuation Report is an in-depth analysis detailing your home's value as well as a comparison with similar homes in the area
Home Values in the Area
Average Home Value in this Area
Purchase History
| Date | Buyer | Sale Price | Title Company |
|---|---|---|---|
| Martin Brian K | $145,000 | -- | |
| Hoeft Sheila A | $89,000 | -- | |
| Hoeft Sheila A | $89,000 | -- | |
| Laporte Felix | $100,000 | -- | |
| Laporte Felix | $100,000 | -- |
Source: Public Records
Mortgage History
| Date | Status | Borrower | Loan Amount |
|---|---|---|---|
| Closed | Laporte Felix | $138,000 | |
| Closed | Laporte Felix | $15,000 | |
| Closed | Laporte Felix | $132,000 |
Source: Public Records
Tax History
| Year | Tax Paid | Tax Assessment Tax Assessment Total Assessment is a certain percentage of the fair market value that is determined by local assessors to be the total taxable value of land and additions on the property. | Land | Improvement |
|---|---|---|---|---|
| 2025 | $5,217 | $421,400 | $201,700 | $219,700 |
| 2024 | $5,137 | $403,500 | $183,800 | $219,700 |
| 2023 | $4,984 | $367,800 | $170,800 | $197,000 |
| 2022 | $4,800 | $333,100 | $156,100 | $177,000 |
| 2021 | $4,646 | $307,700 | $141,500 | $166,200 |
| 2020 | $4,509 | $302,800 | $136,600 | $166,200 |
| 2019 | $4,398 | $286,700 | $136,600 | $150,100 |
| 2018 | $4,042 | $272,900 | $130,100 | $142,800 |
| 2017 | $3,637 | $251,000 | $123,600 | $127,400 |
| 2016 | $3,524 | $235,400 | $113,800 | $121,600 |
| 2015 | $3,463 | $228,900 | $107,300 | $121,600 |
| 2014 | $3,342 | $212,300 | $97,600 | $114,700 |
Source: Public Records
Map
Nearby Homes
Your Personal Tour Guide
Ask me questions while you tour the home.