Estimated Value: $182,000 - $212,000
2
Beds
1
Bath
976
Sq Ft
$203/Sq Ft
Est. Value
About This Home
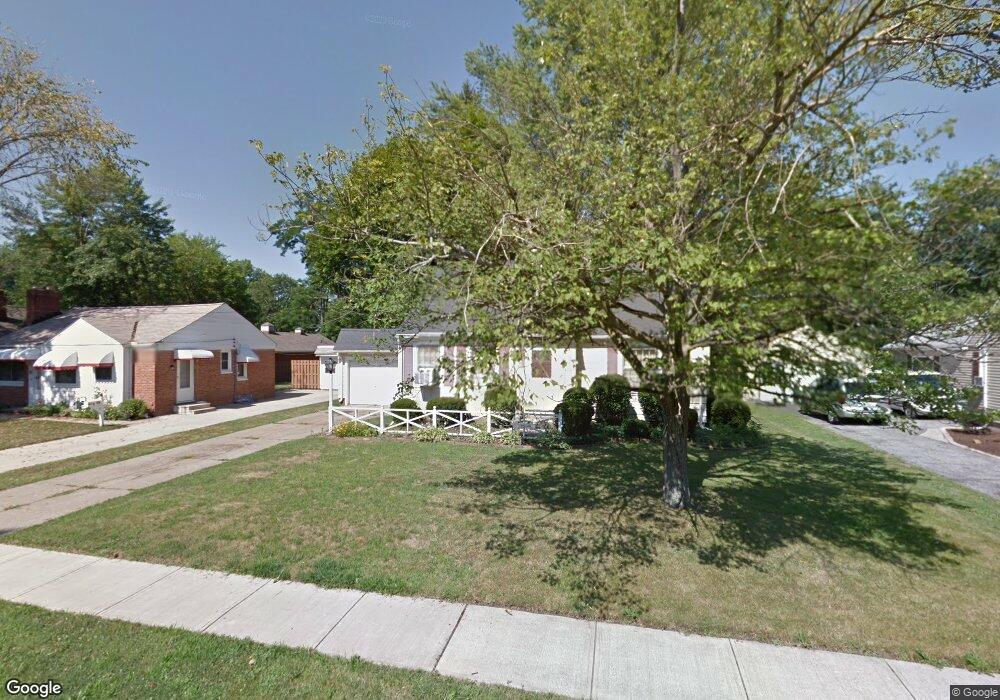
This home is located at 70 Crocker St, Berea, OH 44017 and is currently estimated at $198,614, approximately $203 per square foot. 70 Crocker St is a home located in Cuyahoga County with nearby schools including Grindstone Elementary School, Berea-Midpark Middle School, and Berea-Midpark High School.
Ownership History
Date
Name
Owned For
Owner Type
Purchase Details
Closed on
Jul 18, 2006
Sold by
Scherry Charles S
Bought by
Scherry Lori E
Current Estimated Value
Purchase Details
Closed on
Mar 2, 2002
Sold by
Scherry Charles S and Scherry Lori E
Bought by
Scherry Charles S and Scherry Lori E
Purchase Details
Closed on
Oct 1, 1998
Sold by
Will Of Mook Frances L and Mook Roger D
Bought by
Sherry Charles S and Sherry Lori E
Home Financials for this Owner
Home Financials are based on the most recent Mortgage that was taken out on this home.
Original Mortgage
$104,908
Interest Rate
6.98%
Mortgage Type
FHA
Purchase Details
Closed on
Jan 1, 1975
Bought by
Mook Frances L
Create a Home Valuation Report for This Property
The Home Valuation Report is an in-depth analysis detailing your home's value as well as a comparison with similar homes in the area
Home Values in the Area
Average Home Value in this Area
Purchase History
| Date | Buyer | Sale Price | Title Company |
|---|---|---|---|
| Scherry Lori E | -- | None Available | |
| Scherry Charles S | -- | Resource Title Agency Inc | |
| Sherry Charles S | $105,000 | -- | |
| Mook Frances L | -- | -- |
Source: Public Records
Mortgage History
| Date | Status | Borrower | Loan Amount |
|---|---|---|---|
| Previous Owner | Sherry Charles S | $104,908 |
Source: Public Records
Tax History Compared to Growth
Tax History
| Year | Tax Paid | Tax Assessment Tax Assessment Total Assessment is a certain percentage of the fair market value that is determined by local assessors to be the total taxable value of land and additions on the property. | Land | Improvement |
|---|---|---|---|---|
| 2024 | $3,642 | $63,000 | $15,120 | $47,880 |
| 2023 | $3,153 | $45,650 | $12,080 | $33,570 |
| 2022 | $3,133 | $45,640 | $12,075 | $33,565 |
| 2021 | $3,106 | $45,640 | $12,080 | $33,570 |
| 2020 | $2,967 | $38,680 | $10,220 | $28,460 |
| 2019 | $2,888 | $110,500 | $29,200 | $81,300 |
| 2018 | $2,826 | $38,680 | $10,220 | $28,460 |
| 2017 | $2,980 | $37,250 | $9,770 | $27,480 |
| 2016 | $2,958 | $37,250 | $9,770 | $27,480 |
| 2015 | $2,795 | $37,250 | $9,770 | $27,480 |
| 2014 | $2,795 | $37,250 | $9,770 | $27,480 |
Source: Public Records
Map
Nearby Homes