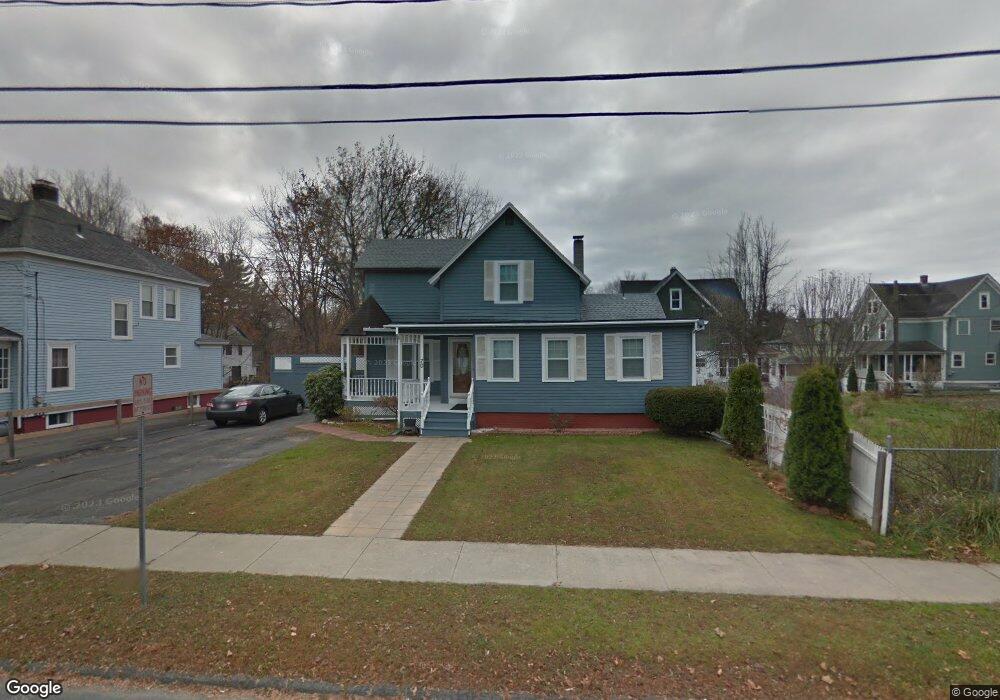
70 Devens St Greenfield, MA 01301
Estimated Value: $243,000 - $300,719
3
Beds
2
Baths
1,446
Sq Ft
$196/Sq Ft
Est. Value
About This Home
This home is located at 70 Devens St, Greenfield, MA 01301 and is currently estimated at $283,680, approximately $196 per square foot. 70 Devens St is a home located in Franklin County with nearby schools including Four Rivers Charter Public School and Cornerstone Christian School.
Ownership History
Date
Name
Owned For
Owner Type
Purchase Details
Closed on
Nov 10, 1993
Sold by
Hall Charles L
Bought by
Delaney Richard J
Current Estimated Value
Purchase Details
Closed on
Jul 14, 1989
Sold by
Barlow John R
Bought by
Hall Charlds L
Create a Home Valuation Report for This Property
The Home Valuation Report is an in-depth analysis detailing your home's value as well as a comparison with similar homes in the area
Home Values in the Area
Average Home Value in this Area
Purchase History
| Date | Buyer | Sale Price | Title Company |
|---|---|---|---|
| Delaney Richard J | $72,000 | -- | |
| Delaney Richard J | $72,000 | -- | |
| Hall Charlds L | $39,000 | -- | |
| Hall Charlds L | $39,000 | -- |
Source: Public Records
Mortgage History
| Date | Status | Borrower | Loan Amount |
|---|---|---|---|
| Open | Hall Charlds L | $96,500 | |
| Closed | Hall Charlds L | $79,000 | |
| Closed | Hall Charlds L | $15,700 |
Source: Public Records
Tax History
| Year | Tax Paid | Tax Assessment Tax Assessment Total Assessment is a certain percentage of the fair market value that is determined by local assessors to be the total taxable value of land and additions on the property. | Land | Improvement |
|---|---|---|---|---|
| 2025 | $4,960 | $253,600 | $46,000 | $207,600 |
| 2024 | $5,061 | $248,200 | $42,000 | $206,200 |
| 2023 | $4,549 | $231,500 | $42,000 | $189,500 |
| 2022 | $4,415 | $197,800 | $40,000 | $157,800 |
| 2021 | $4,324 | $186,200 | $43,000 | $143,200 |
| 2020 | $4,056 | $176,900 | $39,000 | $137,900 |
| 2019 | $3,844 | $171,900 | $34,000 | $137,900 |
| 2018 | $3,782 | $168,600 | $33,400 | $135,200 |
| 2017 | $3,664 | $168,600 | $33,400 | $135,200 |
| 2016 | $3,477 | $159,400 | $29,000 | $130,400 |
| 2015 | $3,370 | $149,700 | $29,400 | $120,300 |
| 2014 | $3,088 | $150,400 | $29,400 | $121,000 |
Source: Public Records
Map
Nearby Homes
- 11 Colrain St
- 59-61 Conway St
- 11 Conway St
- 173-175 Conway St
- 159 Chapman St
- 13 River St
- 8 Water St
- 23 Robbins Rd
- 2 Water St
- 71 Washington St
- 73 Washington St
- 77 Washington St
- 0 Marshall St
- 171 Cleveland St
- 37 Cleveland St
- 62 Peabody Ln
- 427-429 Deerfield St
- 306 Country Side Rd
- 402 Country Side Rd
- 187 Leyden Rd
Your Personal Tour Guide
Ask me questions while you tour the home.