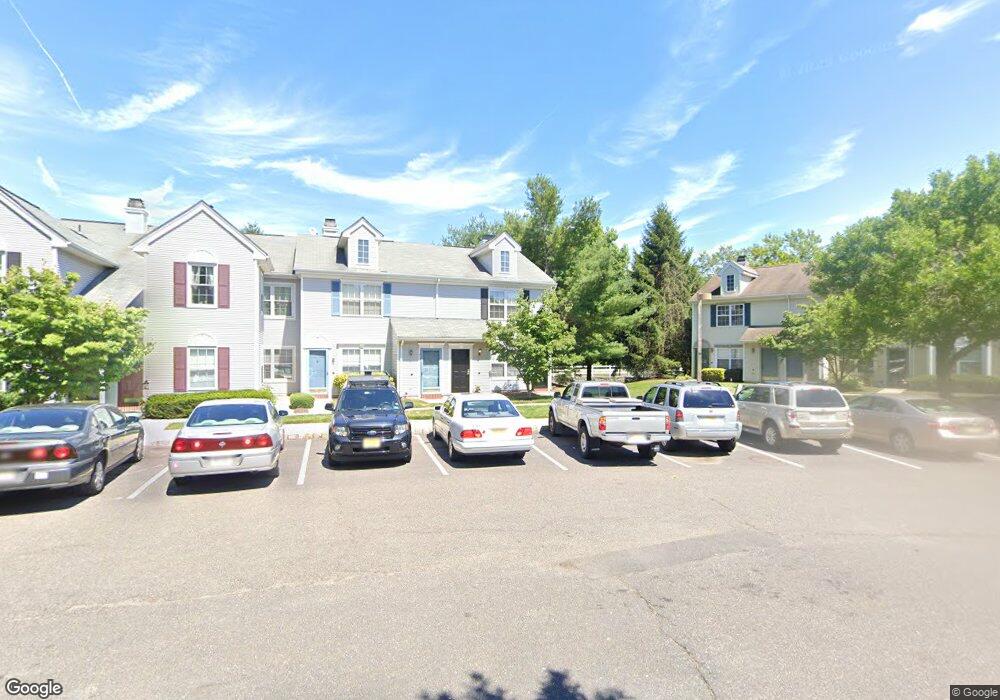
70 Durant Ave Unit C1 Holmdel, NJ 07733
Estimated Value: $156,762 - $183,000
1
Bed
1
Bath
584
Sq Ft
$286/Sq Ft
Est. Value
About This Home
This home is located at 70 Durant Ave Unit C1, Holmdel, NJ 07733 and is currently estimated at $167,254, approximately $286 per square foot. 70 Durant Ave Unit C1 is a home located in Monmouth County with nearby schools including Village School, Indian Hill Elementary School, and William Satz Intermediate School.
Ownership History
Date
Name
Owned For
Owner Type
Purchase Details
Closed on
Feb 16, 2017
Sold by
Amy Kelly
Bought by
Marshall Anita
Current Estimated Value
Home Financials for this Owner
Home Financials are based on the most recent Mortgage that was taken out on this home.
Original Mortgage
$88,515
Outstanding Balance
$73,184
Interest Rate
4.15%
Estimated Equity
$94,070
Purchase Details
Closed on
Dec 4, 2009
Sold by
Township Of Holmdel
Bought by
Rice Amy
Home Financials for this Owner
Home Financials are based on the most recent Mortgage that was taken out on this home.
Original Mortgage
$87,169
Interest Rate
5.5%
Mortgage Type
FHA
Purchase Details
Closed on
Jan 28, 2009
Sold by
Petosa Tina Marie
Bought by
Holmdel Township
Purchase Details
Closed on
Dec 9, 1993
Sold by
K Hovnanian At Holmdel
Bought by
Petosa Tina
Home Financials for this Owner
Home Financials are based on the most recent Mortgage that was taken out on this home.
Original Mortgage
$48,000
Interest Rate
6.78%
Create a Home Valuation Report for This Property
The Home Valuation Report is an in-depth analysis detailing your home's value as well as a comparison with similar homes in the area
Home Values in the Area
Average Home Value in this Area
Purchase History
| Date | Buyer | Sale Price | Title Company |
|---|---|---|---|
| Marshall Anita | -- | -- | |
| Rice Amy | $88,778 | Chicago Title Insurance Co | |
| Holmdel Township | $93,216 | None Available | |
| Petosa Tina | $50,240 | -- |
Source: Public Records
Mortgage History
| Date | Status | Borrower | Loan Amount |
|---|---|---|---|
| Open | Petosa Tina | $88,515 | |
| Closed | Petosa Tina | -- | |
| Previous Owner | Rice Amy | $87,169 | |
| Previous Owner | Petosa Tina | $48,000 |
Source: Public Records
Tax History Compared to Growth
Tax History
| Year | Tax Paid | Tax Assessment Tax Assessment Total Assessment is a certain percentage of the fair market value that is determined by local assessors to be the total taxable value of land and additions on the property. | Land | Improvement |
|---|---|---|---|---|
| 2025 | $2,055 | $130,400 | $50,000 | $80,400 |
| 2024 | $2,001 | $130,400 | $50,000 | $80,400 |
| 2023 | $2,001 | $123,000 | $50,000 | $73,000 |
| 2022 | $2,010 | $109,600 | $50,000 | $59,600 |
| 2021 | $2,010 | $109,600 | $50,000 | $59,600 |
| 2020 | $2,108 | $103,400 | $50,000 | $53,400 |
| 2019 | $1,891 | $93,200 | $50,000 | $43,200 |
| 2018 | $1,884 | $93,200 | $50,000 | $43,200 |
| 2017 | $1,891 | $93,200 | $50,000 | $43,200 |
| 2016 | $1,870 | $93,200 | $50,000 | $43,200 |
| 2015 | $1,863 | $93,200 | $50,000 | $43,200 |
| 2014 | $1,854 | $88,700 | $30,000 | $58,700 |
Source: Public Records
Map
Nearby Homes
- 58 Agostina Dr Unit 250
- 64 Agostina Dr Unit 64
- 8 Stagecoach Dr Unit 13
- 22 Weller Place Unit 22
- 4 Pine Tree Terrace
- 901 Palmer Ave
- 64 Hawthorne Ave
- 846 Palmer Ave
- 6 Ridge Dr
- 8 Leocadia Ct
- 343 Middlewood Rd
- 27 Gibson Dr
- 9 Borick Ave
- 7 John St
- 3 John St Unit 118
- 35 Violet Ct
- 17 Avenue D
- 1305 Arose Ln
- 22 Avenue D Unit 45
- 9 Avenue C Unit 61
- 71 Durant Ave Unit C2
- 68 Durant Ave Unit D1
- 72 Durant Ave
- 73 Durant Ave
- 69 Durant Ave
- 75 Durant Ave
- 74 Durant Ave
- 67 Durant Ave
- 66 Durant Ave
- 65 Durant Ave
- 64 Durant Ave
- 63 Durant Ave Unit 32C2
- 62 Durant Ave
- 61 Durant Ave
- 60 Durant Ave
- 60 Durant Ave Unit 114
- 53 Durant Ave
- 52 Durant Ave Unit 30C
- 51 Durant Ave
- 51 Durant Ave Unit 131