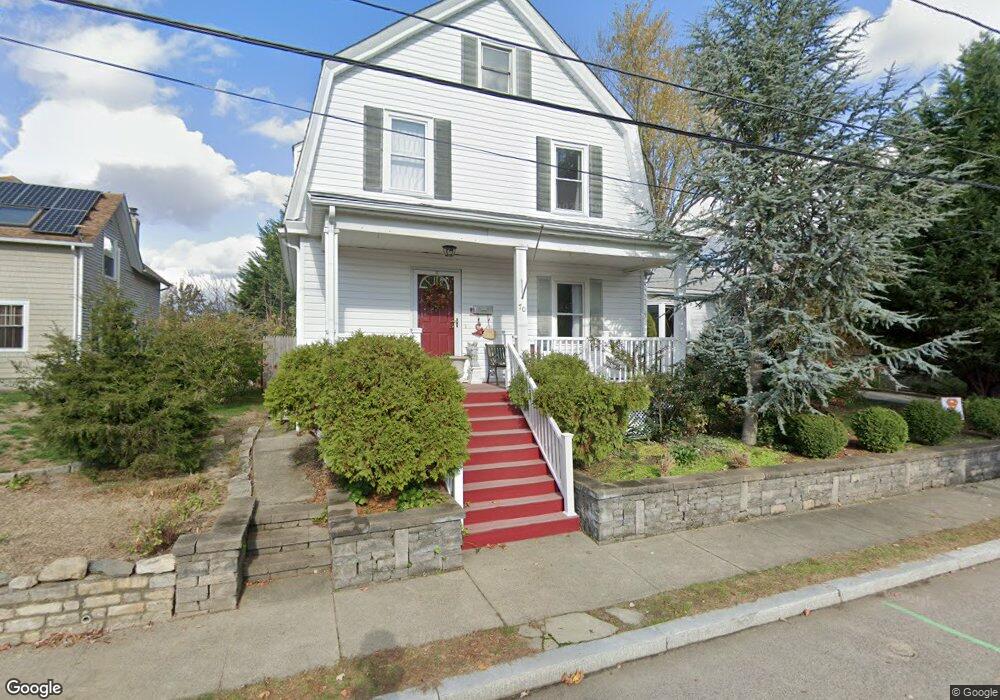
70 Dyer Ave Riverside, RI 02915
Riverside NeighborhoodEstimated Value: $500,081 - $569,000
4
Beds
3
Baths
2,698
Sq Ft
$199/Sq Ft
Est. Value
About This Home
This home is located at 70 Dyer Ave, Riverside, RI 02915 and is currently estimated at $538,020, approximately $199 per square foot. 70 Dyer Ave is a home located in Providence County with nearby schools including East Providence High School, St Mary Academy-Bay View, and St Luke Elementary School.
Ownership History
Date
Name
Owned For
Owner Type
Purchase Details
Closed on
Dec 20, 2019
Sold by
Vieira Stephanie S
Bought by
Vieira Stephanie
Current Estimated Value
Home Financials for this Owner
Home Financials are based on the most recent Mortgage that was taken out on this home.
Original Mortgage
$465,000
Outstanding Balance
$457,384
Interest Rate
3.6%
Mortgage Type
Reverse Mortgage Home Equity Conversion Mortgage
Estimated Equity
$80,636
Purchase Details
Closed on
Jan 12, 2009
Sold by
Moore James and Moore Dorothy
Bought by
Vieira Stephanie S
Purchase Details
Closed on
May 8, 2003
Sold by
Adams Dale
Bought by
Moore James and Moore Dorothy
Create a Home Valuation Report for This Property
The Home Valuation Report is an in-depth analysis detailing your home's value as well as a comparison with similar homes in the area
Home Values in the Area
Average Home Value in this Area
Purchase History
| Date | Buyer | Sale Price | Title Company |
|---|---|---|---|
| Vieira Stephanie | -- | None Available | |
| Vieira Stephanie | -- | None Available | |
| Vieira Stephanie S | $295,000 | -- | |
| Moore James | $215,000 | -- | |
| Vieira Stephanie S | $295,000 | -- | |
| Moore James | $215,000 | -- |
Source: Public Records
Mortgage History
| Date | Status | Borrower | Loan Amount |
|---|---|---|---|
| Open | Vieira Stephanie | $465,000 | |
| Closed | Vieira Stephanie | $465,000 | |
| Previous Owner | Moore James | $50,000 | |
| Previous Owner | Moore James | $124,716 |
Source: Public Records
Tax History
| Year | Tax Paid | Tax Assessment Tax Assessment Total Assessment is a certain percentage of the fair market value that is determined by local assessors to be the total taxable value of land and additions on the property. | Land | Improvement |
|---|---|---|---|---|
| 2025 | $6,291 | $481,300 | $95,300 | $386,000 |
| 2024 | $5,758 | $375,600 | $79,400 | $296,200 |
| 2023 | $5,544 | $375,600 | $79,400 | $296,200 |
| 2022 | $6,147 | $281,200 | $47,600 | $233,600 |
| 2021 | $6,046 | $281,200 | $46,900 | $234,300 |
| 2020 | $5,790 | $281,200 | $46,900 | $234,300 |
| 2019 | $5,630 | $281,200 | $46,900 | $234,300 |
| 2018 | $5,967 | $260,800 | $50,300 | $210,500 |
| 2017 | $5,834 | $260,800 | $50,300 | $210,500 |
| 2016 | $5,805 | $260,800 | $50,300 | $210,500 |
| 2015 | $6,270 | $273,200 | $49,100 | $224,100 |
| 2014 | $6,270 | $273,200 | $49,100 | $224,100 |
Source: Public Records
Map
Nearby Homes
- 25 Arnold St
- 151 Willett Ave Unit 2
- 103 Burnside Ave
- 28 Jefferson Ave
- 33 Pine St Unit 35
- 43 Bullocks Point Ave Unit 4A
- 25 Bullocks Point Ave Unit 5C
- 33 Bullocks Point Ave Unit 5C
- 6 Fuller Ave
- 72 Stowe Ave
- 25 Winslow St
- 129 Shore Rd
- 14 Benedict St
- 14 Winthrop St
- 41 White Ave
- 15 Claire St
- 10 Booth Ave
- 85 Hilton Ave
- 15 Plaza Dr
- 0 Carousel Dr
Your Personal Tour Guide
Ask me questions while you tour the home.