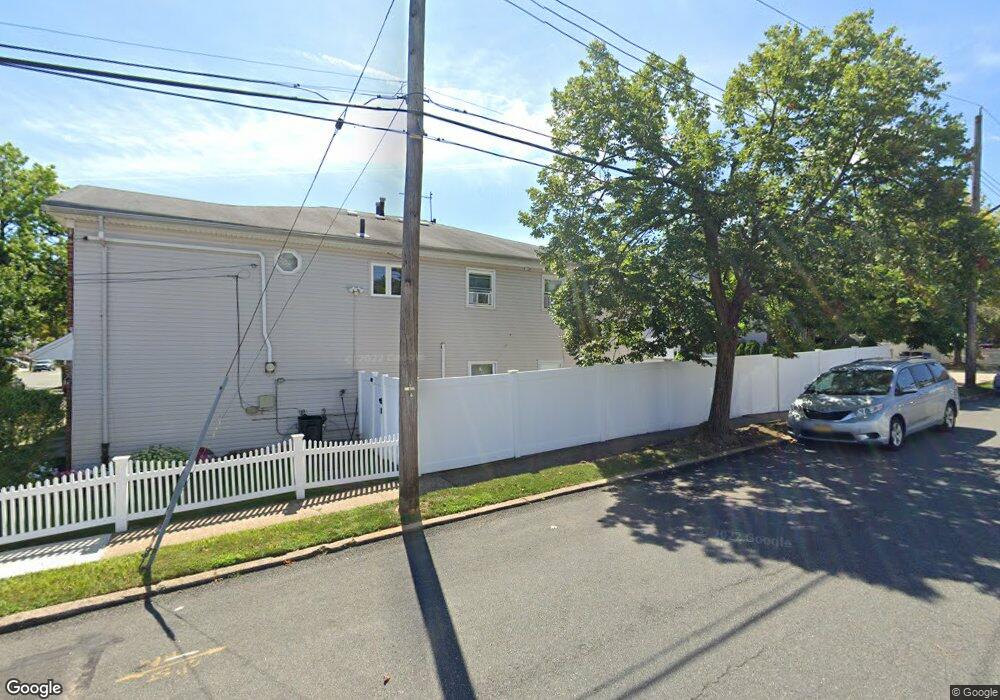
70 E Broadway Staten Island, NY 10306
Oakwood NeighborhoodEstimated Value: $778,000 - $861,000
4
Beds
2
Baths
1,840
Sq Ft
$452/Sq Ft
Est. Value
About This Home
This home is located at 70 E Broadway, Staten Island, NY 10306 and is currently estimated at $831,194, approximately $451 per square foot. 70 E Broadway is a home located in Richmond County with nearby schools including P.S. 23 Richmondtown, Myra S. Barnes Intermediate School 24, and New Dorp High School.
Ownership History
Date
Name
Owned For
Owner Type
Purchase Details
Closed on
Apr 12, 2017
Sold by
Thomas J Brennan
Bought by
Milillo Kimberly and Milillo Michael
Current Estimated Value
Home Financials for this Owner
Home Financials are based on the most recent Mortgage that was taken out on this home.
Original Mortgage
$344,245
Outstanding Balance
$280,734
Interest Rate
4.1%
Estimated Equity
$550,460
Purchase Details
Closed on
Dec 13, 2005
Sold by
Brennan Thomas J and Brennan Doris R
Bought by
Milillo Michael J and Milillo Kimberly B
Home Financials for this Owner
Home Financials are based on the most recent Mortgage that was taken out on this home.
Original Mortgage
$330,000
Interest Rate
6.15%
Mortgage Type
Fannie Mae Freddie Mac
Create a Home Valuation Report for This Property
The Home Valuation Report is an in-depth analysis detailing your home's value as well as a comparison with similar homes in the area
Home Values in the Area
Average Home Value in this Area
Purchase History
We collect this data history from publicly available records. To have your information removed, we recommend requesting removal directly through your county’s website.
| Date | Buyer | Sale Price | Title Company |
|---|---|---|---|
| Milillo Kimberly | -- | -- | |
| Milillo Michael J | $450,000 | None Available |
Source: Public Records
Mortgage History
We collect this data history from publicly available records. To have your information removed, we recommend requesting removal directly through your county’s website.
| Date | Status | Borrower | Loan Amount |
|---|---|---|---|
| Open | Milillo Kimberly | $344,245 | |
| Closed | Milillo Kimberly | -- | |
| Previous Owner | Milillo Michael J | $330,000 |
Source: Public Records
Tax History
| Year | Tax Paid | Tax Assessment Tax Assessment Total Assessment is a certain percentage of the fair market value that is determined by local assessors to be the total taxable value of land and additions on the property. | Land | Improvement |
|---|---|---|---|---|
| 2026 | $7,727 | $48,540 | $8,382 | $40,158 |
| 2025 | $7,334 | $49,080 | $8,290 | $40,790 |
| 2024 | $7,346 | $41,760 | $9,261 | $32,499 |
| 2023 | $6,980 | $35,771 | $7,737 | $28,034 |
| 2022 | $6,684 | $41,760 | $10,200 | $31,560 |
| 2021 | $6,693 | $41,580 | $10,200 | $31,380 |
| 2020 | $6,740 | $37,980 | $10,200 | $27,780 |
| 2019 | $6,317 | $38,820 | $10,200 | $28,620 |
| 2018 | $5,779 | $29,809 | $9,936 | $19,873 |
| 2017 | $5,632 | $29,100 | $10,200 | $18,900 |
| 2016 | $5,228 | $27,702 | $9,039 | $18,663 |
| 2015 | $4,748 | $27,702 | $8,178 | $19,524 |
| 2014 | $4,748 | $26,330 | $7,709 | $18,621 |
Source: Public Records
Map
Nearby Homes
Your Personal Tour Guide
Ask me questions while you tour the home.