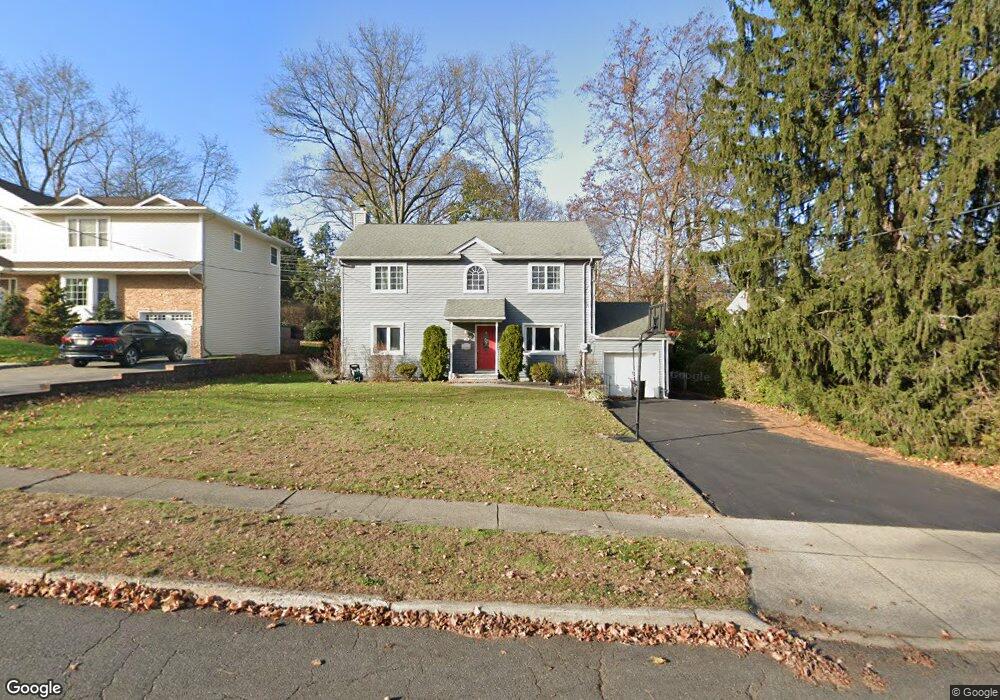
70 E Gramercy Place Glen Rock, NJ 07452
Estimated Value: $960,000 - $1,770,000
--
Bed
--
Bath
2,012
Sq Ft
$626/Sq Ft
Est. Value
About This Home
This home is located at 70 E Gramercy Place, Glen Rock, NJ 07452 and is currently estimated at $1,258,541, approximately $625 per square foot. 70 E Gramercy Place is a home located in Bergen County with nearby schools including Glen Rock Middle School, Glen Rock High School, and Academy Of Our Lady At St Catharine.
Ownership History
Date
Name
Owned For
Owner Type
Purchase Details
Closed on
Dec 5, 2020
Sold by
Depalma John Anthony and Depalma Mercredi
Bought by
Redacted Upon Request
Current Estimated Value
Home Financials for this Owner
Home Financials are based on the most recent Mortgage that was taken out on this home.
Original Mortgage
$240,000
Interest Rate
2.7%
Mortgage Type
New Conventional
Purchase Details
Closed on
Aug 18, 2020
Sold by
Depalma Scott V and Estate Of Dorothy De Palma
Bought by
Depalma John Anthony
Purchase Details
Closed on
Oct 27, 2005
Create a Home Valuation Report for This Property
The Home Valuation Report is an in-depth analysis detailing your home's value as well as a comparison with similar homes in the area
Home Values in the Area
Average Home Value in this Area
Purchase History
| Date | Buyer | Sale Price | Title Company |
|---|---|---|---|
| Redacted Upon Request | -- | Litwack Robert C | |
| Depalma John Anthony | -- | None Available | |
| -- | -- | -- |
Source: Public Records
Mortgage History
| Date | Status | Borrower | Loan Amount |
|---|---|---|---|
| Previous Owner | Redacted Upon Request | $240,000 |
Source: Public Records
Tax History Compared to Growth
Tax History
| Year | Tax Paid | Tax Assessment Tax Assessment Total Assessment is a certain percentage of the fair market value that is determined by local assessors to be the total taxable value of land and additions on the property. | Land | Improvement |
|---|---|---|---|---|
| 2025 | $19,337 | $588,100 | $283,900 | $304,200 |
| 2024 | $18,584 | $588,100 | $283,900 | $304,200 |
| 2023 | $18,119 | $588,100 | $283,900 | $304,200 |
| 2022 | $18,119 | $588,100 | $283,900 | $304,200 |
| 2021 | $17,234 | $588,100 | $283,900 | $304,200 |
| 2020 | $17,931 | $588,100 | $283,900 | $304,200 |
| 2019 | $17,461 | $588,100 | $283,900 | $304,200 |
| 2018 | $16,978 | $588,100 | $283,900 | $304,200 |
| 2017 | $16,649 | $588,100 | $283,900 | $304,200 |
| 2016 | $16,408 | $588,100 | $283,900 | $304,200 |
| 2015 | $15,649 | $588,100 | $283,900 | $304,200 |
| 2014 | $15,438 | $588,100 | $283,900 | $304,200 |
Source: Public Records
Map
Nearby Homes
- 674 Ackerman Ave
- 145 Midwood Rd
- 18 Locust Rd
- 470 Prospect St
- 21 Manor Ct
- 90 Delmar Ave
- 728 Prospect St
- 11 Carol Ct
- 742 Prospect St
- 135 Pinelynn Rd
- 16 Highwood Terrace
- 163 Delmar Ave
- 540 S Maple Ave
- 7 Chadwick Place
- 142 Ellsworth Terrace
- 522 Grove St
- 209 Cornwall Rd
- 26 Gaynor Place
- 394 Ackerman Ave
- 14 S Highwood Ave
- 66 E Gramercy Place
- 76 E Gramercy Place
- 60 E Gramercy Place
- 69 E Gramercy Place
- 65 E Gramercy Place
- 84 E Gramercy Place
- 54 E Gramercy Place
- 81 E Gramercy Place
- 59 E Gramercy Place
- 554 Rock Rd
- 548 Rock Rd
- 88 E Gramercy Place
- 558 Rock Rd
- 544 Rock Rd
- 53 E Gramercy Place
- 48 E Gramercy Place
- 562 Rock Rd
- 91 E Gramercy Place
- 538 Rock Rd
- 811 Harristown Rd