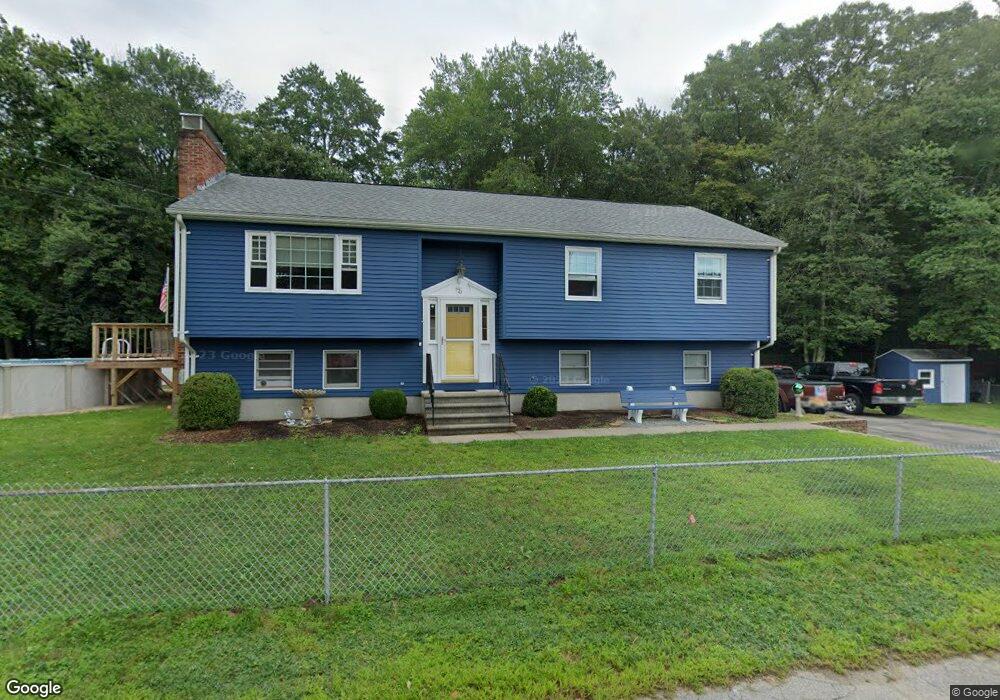
70 Elbow St Bellingham, MA 02019
Estimated Value: $486,000 - $558,000
3
Beds
2
Baths
2,042
Sq Ft
$257/Sq Ft
Est. Value
About This Home
This home is located at 70 Elbow St, Bellingham, MA 02019 and is currently estimated at $525,805, approximately $257 per square foot. 70 Elbow St is a home located in Norfolk County with nearby schools including Joseph F. DiPietro Elementary, Bellingham High School, and Rise Prep Mayoral Academy Middle School.
Ownership History
Date
Name
Owned For
Owner Type
Purchase Details
Closed on
Jul 17, 2018
Sold by
Campano Richard L Est and Campano
Bought by
Campano Richard L
Current Estimated Value
Create a Home Valuation Report for This Property
The Home Valuation Report is an in-depth analysis detailing your home's value as well as a comparison with similar homes in the area
Home Values in the Area
Average Home Value in this Area
Purchase History
| Date | Buyer | Sale Price | Title Company |
|---|---|---|---|
| Campano Richard L | -- | -- |
Source: Public Records
Tax History Compared to Growth
Tax History
| Year | Tax Paid | Tax Assessment Tax Assessment Total Assessment is a certain percentage of the fair market value that is determined by local assessors to be the total taxable value of land and additions on the property. | Land | Improvement |
|---|---|---|---|---|
| 2025 | $5,538 | $440,900 | $125,900 | $315,000 |
| 2024 | $5,332 | $414,600 | $114,900 | $299,700 |
| 2023 | $5,138 | $393,700 | $109,400 | $284,300 |
| 2022 | $5,050 | $358,700 | $91,300 | $267,400 |
| 2021 | $4,860 | $337,300 | $91,300 | $246,000 |
| 2020 | $4,703 | $330,700 | $91,300 | $239,400 |
| 2019 | $4,587 | $322,800 | $91,300 | $231,500 |
| 2018 | $4,242 | $294,400 | $88,700 | $205,700 |
| 2017 | $4,098 | $285,800 | $88,700 | $197,100 |
| 2016 | $3,788 | $265,100 | $91,100 | $174,000 |
| 2015 | $3,661 | $256,900 | $88,300 | $168,600 |
| 2014 | $3,888 | $265,200 | $93,000 | $172,200 |
Source: Public Records
Map
Nearby Homes
- 21 Irving St
- 91 Moody St
- 194 Paine St
- 90 Pleasant St
- 20 Cooks Ln
- 30 Oak St
- 202 Paine St
- 540 Pulaski Blvd
- 188 Saint Louis Ave
- 41 Mansion St
- 212 Saint Louis Ave
- Lot 2 Pulaski Blvd
- 70 Oswego St
- 60 Freeman St
- 110 Linden Ave
- 226 St Louis Ave
- 7 Elmwood St
- 110 Saint Leon Ave
- 127 St Leon Ave
- 340 Wrentham Rd