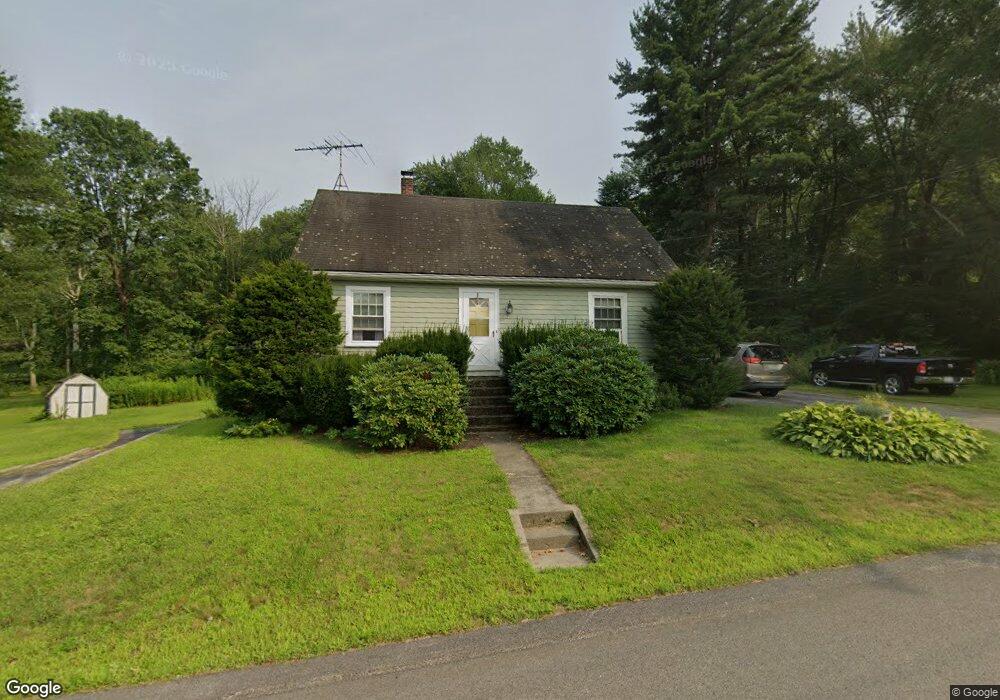
70 Farm St Millis, MA 02054
Estimated Value: $422,000 - $544,000
3
Beds
1
Bath
1,227
Sq Ft
$389/Sq Ft
Est. Value
About This Home
This home is located at 70 Farm St, Millis, MA 02054 and is currently estimated at $477,054, approximately $388 per square foot. 70 Farm St is a home located in Norfolk County with nearby schools including Clyde F Brown, Millis Middle School, and Millis High School.
Ownership History
Date
Name
Owned For
Owner Type
Purchase Details
Closed on
Oct 9, 2013
Sold by
Riggs Jean A and Leontie Alek J
Bought by
Mckenney Susan M
Current Estimated Value
Home Financials for this Owner
Home Financials are based on the most recent Mortgage that was taken out on this home.
Original Mortgage
$105,000
Outstanding Balance
$78,043
Interest Rate
4.53%
Mortgage Type
New Conventional
Estimated Equity
$399,011
Create a Home Valuation Report for This Property
The Home Valuation Report is an in-depth analysis detailing your home's value as well as a comparison with similar homes in the area
Home Values in the Area
Average Home Value in this Area
Purchase History
| Date | Buyer | Sale Price | Title Company |
|---|---|---|---|
| Mckenney Susan M | $150,000 | -- | |
| Mckenney Susan M | $150,000 | -- |
Source: Public Records
Mortgage History
| Date | Status | Borrower | Loan Amount |
|---|---|---|---|
| Open | Mckenney Susan M | $105,000 | |
| Closed | Mckenney Susan M | $105,000 |
Source: Public Records
Tax History
| Year | Tax Paid | Tax Assessment Tax Assessment Total Assessment is a certain percentage of the fair market value that is determined by local assessors to be the total taxable value of land and additions on the property. | Land | Improvement |
|---|---|---|---|---|
| 2025 | $6,268 | $382,200 | $173,500 | $208,700 |
| 2024 | $5,967 | $363,400 | $173,500 | $189,900 |
| 2023 | $5,714 | $326,700 | $150,900 | $175,800 |
| 2022 | $5,658 | $299,700 | $150,900 | $148,800 |
| 2021 | $6,143 | $313,100 | $150,900 | $162,200 |
| 2020 | $6,298 | $312,700 | $141,000 | $171,700 |
| 2019 | $5,487 | $293,400 | $129,800 | $163,600 |
| 2018 | $5,074 | $281,600 | $118,000 | $163,600 |
| 2017 | $4,935 | $267,900 | $115,000 | $152,900 |
| 2016 | $4,672 | $267,900 | $115,000 | $152,900 |
| 2015 | $4,554 | $267,900 | $115,000 | $152,900 |
Source: Public Records
Map
Nearby Homes
Your Personal Tour Guide
Ask me questions while you tour the home.