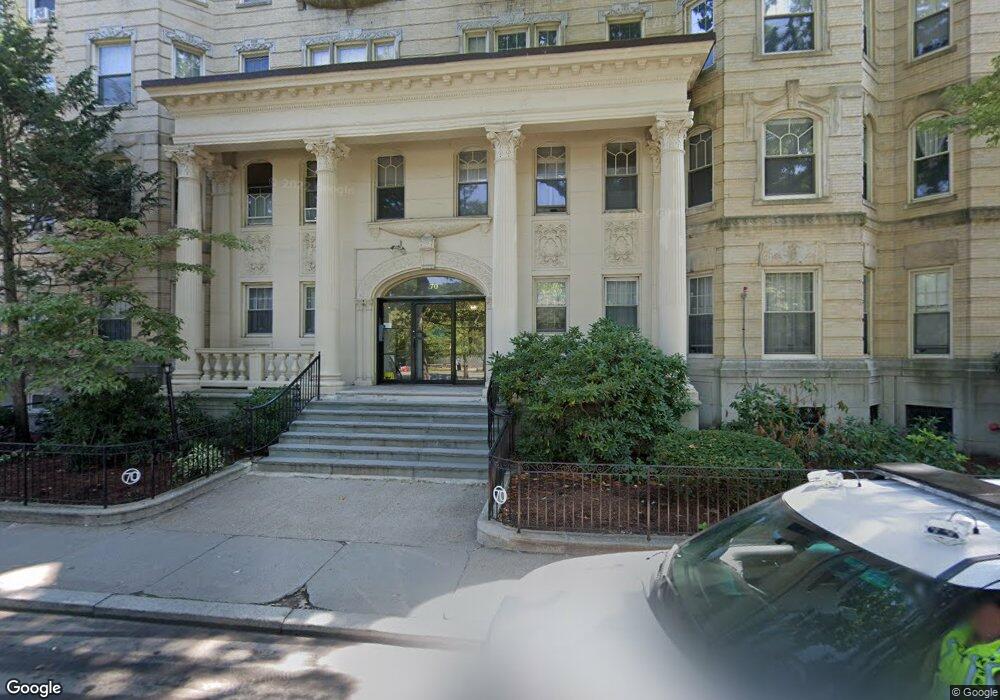
70 Fenway Unit 31 Boston, MA 02115
Fenway NeighborhoodEstimated Value: $870,862 - $1,053,000
About This Home
In a high end condo building right in the middle of highly desirable Fenway area, close to everything Boston has to offer! Building features elevator & laundry facilities with rental parking available! Shared roof deck on the top floor with excellent panoramic views of the Fens & the city!
All Green Line trains are close by at Kenmore Station, as well as multiple major MBTA bus routes! Close to top schools, hospitals, and attractions! Near Landmark Center, Berklee College, MCPHS, Boston University, Mass Art, Boston University, Simmons, Wentworth, Symphony Hall, Beth Israel, Wheelock, Harvard School of Medicine, Longwood Medical Area, Emmanuel, Brigham & Women’s, Children’s Hospital, Back Bay, Newbury Street, Copley, Fenway Park, and Kenmore Square!
Ownership History
Purchase Details
Home Financials for this Owner
Home Financials are based on the most recent Mortgage that was taken out on this home.Home Values in the Area
Average Home Value in this Area
Purchase History
| Date | Buyer | Sale Price | Title Company |
|---|---|---|---|
| Byrne Eleanor | $165,000 | -- |
Mortgage History
| Date | Status | Borrower | Loan Amount |
|---|---|---|---|
| Open | Byrne Eleanor | $156,750 |
Property History
| Date | Event | Price | List to Sale | Price per Sq Ft |
|---|---|---|---|---|
| 06/18/2025 06/18/25 | Off Market | $3,580 | -- | -- |
| 02/06/2025 02/06/25 | For Rent | $3,580 | 0.0% | -- |
| 01/20/2025 01/20/25 | For Rent | $3,580 | -- | -- |
Tax History
| Year | Tax Paid | Tax Assessment Tax Assessment Total Assessment is a certain percentage of the fair market value that is determined by local assessors to be the total taxable value of land and additions on the property. | Land | Improvement |
|---|---|---|---|---|
| 2025 | $8,990 | $776,300 | $0 | $776,300 |
| 2024 | $7,940 | $728,400 | $0 | $728,400 |
| 2023 | $7,590 | $706,700 | $0 | $706,700 |
| 2022 | $7,541 | $693,100 | $0 | $693,100 |
| 2021 | $7,250 | $679,500 | $0 | $679,500 |
| 2020 | $7,295 | $690,800 | $0 | $690,800 |
| 2019 | $6,805 | $645,600 | $0 | $645,600 |
| 2018 | $6,266 | $597,900 | $0 | $597,900 |
| 2017 | $6,027 | $569,100 | $0 | $569,100 |
| 2016 | $5,962 | $542,000 | $0 | $542,000 |
| 2015 | $5,869 | $484,600 | $0 | $484,600 |
| 2014 | $5,538 | $440,200 | $0 | $440,200 |
Map
- 50 Symphony Rd Unit 402
- 84 Gainsborough St Unit 206W
- 65 Hemenway St Unit 1
- 79 Gainsborough St Unit 103
- 43 Westland Ave Unit 509
- 43 Westland Ave Unit 510
- 43 Westland Ave Unit 112
- 43 Westland Ave Unit 602
- 43 Westland Ave Unit 712
- 43 Westland Ave Unit 212
- 39 Hemenway St Unit 27
- 51 Park Dr Unit 31
- 51 Park Dr Unit 9
- 51 Park Dr Unit 25
- 12 Stoneholm St Unit 307
- 12 Stoneholm St Unit 2
- 12 Stoneholm St Unit 1
- 12 Stoneholm St Unit 423
- 12 Stoneholm St Unit 516
- 12 Stoneholm St Unit 520
- 70 Fenway Unit 32
- 70 Fenway Unit 56
- 70 Fenway Unit 55
- 70 Fenway Unit 54
- 70 Fenway Unit 53
- 70 Fenway Unit 52
- 70 Fenway Unit 46
- 70 Fenway Unit 46
- 70 Fenway Unit 44
- 70 Fenway Unit 43
- 70 Fenway Unit 42
- 70 Fenway Unit 41
- 70 Fenway Unit 36
- 70 Fenway Unit 35
- 70 Fenway Unit 34
- 70 Fenway Unit 33
- 70 Fenway Unit 32
- 70 Fenway Unit 26
- 70 Fenway Unit 25
- 70 Fenway Unit 23
Ask me questions while you tour the home.