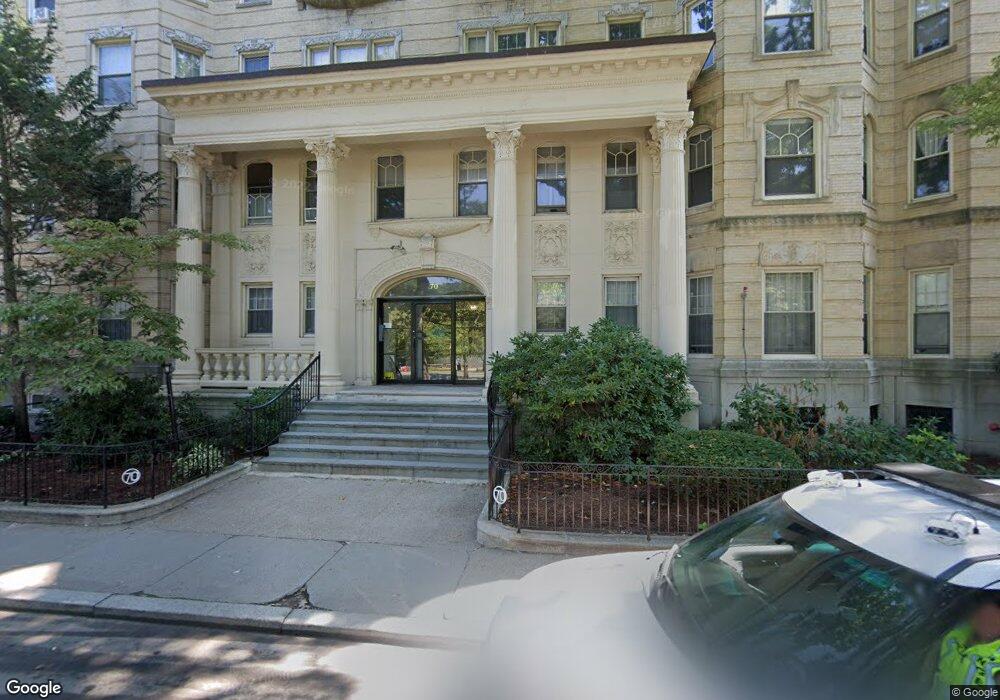
70 Fenway Unit 44 Boston, MA 02115
Fenway NeighborhoodEstimated Value: $622,000 - $738,000
About This Home
In a high end condo building right in the middle of highly desirable Fenway area, close to everything Boston has to offer! Building features elevator & laundry facilities with rental parking available! Shared roof deck on the top floor with excellent panoramic views of the Fens & the city!
All Green Line trains are close by at Kenmore Station, as well as multiple major MBTA bus routes! Close to top schools, hospitals, and attractions! Near Landmark Center, Berklee College, MCPHS, Boston University, Mass Art, Boston University, Simmons, Wentworth, Symphony Hall, Beth Israel, Wheelock, Harvard School of Medicine, Longwood Medical Area, Emmanuel, Brigham & Women’s, Children’s Hospital, Back Bay, Newbury Street, Copley, Fenway Park, and Kenmore Square!
Ownership History
Purchase Details
Purchase Details
Purchase Details
Purchase Details
Home Values in the Area
Average Home Value in this Area
Purchase History
| Date | Buyer | Sale Price | Title Company |
|---|---|---|---|
| Levin Svetlana | -- | -- | |
| Dobrushkin Albert | -- | -- | |
| Dobrushkin Llc | -- | -- | |
| Dobrushkin Albert | -- | -- | |
| Dobrushkin Llc | -- | -- | |
| Dobrushkin Albert | $35,000 | -- |
Property History
| Date | Event | Price | List to Sale | Price per Sq Ft |
|---|---|---|---|---|
| 06/18/2025 06/18/25 | Off Market | $6,350 | -- | -- |
| 02/06/2025 02/06/25 | For Rent | $6,350 | 0.0% | -- |
| 01/13/2025 01/13/25 | For Rent | $6,350 | -- | -- |
Tax History Compared to Growth
Tax History
| Year | Tax Paid | Tax Assessment Tax Assessment Total Assessment is a certain percentage of the fair market value that is determined by local assessors to be the total taxable value of land and additions on the property. | Land | Improvement |
|---|---|---|---|---|
| 2025 | $6,320 | $545,800 | $0 | $545,800 |
| 2024 | $5,624 | $516,000 | $0 | $516,000 |
| 2023 | $5,376 | $500,600 | $0 | $500,600 |
| 2022 | $5,341 | $490,900 | $0 | $490,900 |
| 2021 | $5,135 | $481,300 | $0 | $481,300 |
| 2020 | $5,136 | $486,400 | $0 | $486,400 |
| 2019 | $4,791 | $454,600 | $0 | $454,600 |
| 2018 | $4,412 | $421,000 | $0 | $421,000 |
| 2017 | $4,244 | $400,800 | $0 | $400,800 |
| 2016 | $4,199 | $381,700 | $0 | $381,700 |
| 2015 | $3,943 | $325,600 | $0 | $325,600 |
| 2014 | $3,720 | $295,700 | $0 | $295,700 |
Map
- 74 Fenway Unit 56
- 74 Fenway Unit 35
- 70 Fenway Unit 51
- 102 & 108 Gainsborough St Unit 406W
- 75 Burbank St Unit 501
- 75 Burbank St Unit 203
- 43 Westland Ave Unit 610
- 17 Symphony Rd Unit 8
- 17 Symphony Rd Unit 6
- 30 Fenway Unit 2nd/3rd FL
- 28 Fenway
- 51 Park Dr Unit 34
- 51 Park Dr Unit 25
- 63 Park Dr Unit 63
- 12 Stoneholm St Unit 420
- 12 Stoneholm St Unit 614
- 12 Stoneholm St Unit 423
- 12 Stoneholm St Unit 307
- 12 Stoneholm St Unit 529
- 11 Park Dr Unit 28
- 70 Fenway Unit 32
- 70 Fenway Unit 56
- 70 Fenway Unit 55
- 70 Fenway Unit 54
- 70 Fenway Unit 53
- 70 Fenway Unit 52
- 70 Fenway Unit 46
- 70 Fenway Unit 45
- 70 Fenway Unit 43
- 70 Fenway Unit 42
- 70 Fenway Unit 41
- 70 Fenway Unit 36
- 70 Fenway Unit 35
- 70 Fenway Unit 34
- 70 Fenway Unit 33
- 70 Fenway Unit 32
- 70 Fenway Unit 31
- 70 Fenway Unit 26
- 70 Fenway Unit 25
- 70 Fenway Unit 23