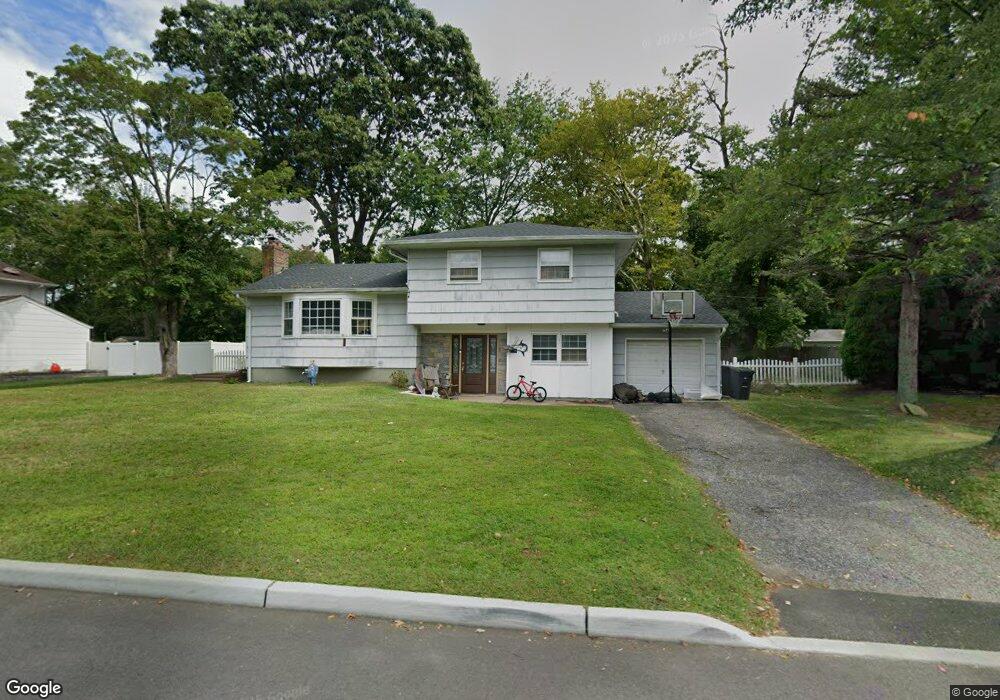
70 Golf St West Long Branch, NJ 07764
Estimated Value: $714,000 - $820,000
3
Beds
2
Baths
1,668
Sq Ft
$469/Sq Ft
Est. Value
About This Home
This home is located at 70 Golf St, West Long Branch, NJ 07764 and is currently estimated at $782,864, approximately $469 per square foot. 70 Golf St is a home located in Monmouth County with nearby schools including Betty McElmon Elementary School, Frank Antonides School, and Shore Regional High School.
Ownership History
Date
Name
Owned For
Owner Type
Purchase Details
Closed on
Aug 25, 2020
Sold by
Campi Anthony V and Estate Of Carole Ann Campi
Bought by
Campi Jake
Current Estimated Value
Home Financials for this Owner
Home Financials are based on the most recent Mortgage that was taken out on this home.
Original Mortgage
$313,000
Interest Rate
3.5%
Mortgage Type
New Conventional
Purchase Details
Closed on
Feb 11, 2008
Sold by
Campi Anthony V and Campi Carole Ann
Bought by
Campi Anthony and Campi Carole Ann
Create a Home Valuation Report for This Property
The Home Valuation Report is an in-depth analysis detailing your home's value as well as a comparison with similar homes in the area
Home Values in the Area
Average Home Value in this Area
Purchase History
| Date | Buyer | Sale Price | Title Company |
|---|---|---|---|
| Campi Jake | $313,000 | Foundation Title Llc | |
| Campi Jake | $313,000 | Foundation Title | |
| Campi Anthony | -- | None Available |
Source: Public Records
Mortgage History
| Date | Status | Borrower | Loan Amount |
|---|---|---|---|
| Previous Owner | Campi Jake | $313,000 |
Source: Public Records
Tax History Compared to Growth
Tax History
| Year | Tax Paid | Tax Assessment Tax Assessment Total Assessment is a certain percentage of the fair market value that is determined by local assessors to be the total taxable value of land and additions on the property. | Land | Improvement |
|---|---|---|---|---|
| 2025 | $9,468 | $799,800 | $524,300 | $275,500 |
| 2024 | $9,279 | $726,600 | $456,100 | $270,500 |
| 2023 | $9,279 | $664,200 | $400,000 | $264,200 |
| 2022 | $7,490 | $544,200 | $300,000 | $244,200 |
| 2021 | $7,490 | $387,500 | $225,000 | $162,500 |
| 2020 | $7,373 | $358,800 | $200,000 | $158,800 |
| 2019 | $7,632 | $373,400 | $200,000 | $173,400 |
| 2018 | $7,518 | $355,300 | $190,000 | $165,300 |
| 2017 | $7,763 | $350,300 | $190,000 | $160,300 |
| 2016 | $7,252 | $333,900 | $202,500 | $131,400 |
| 2015 | $6,938 | $330,500 | $202,500 | $128,000 |
| 2014 | $6,442 | $287,100 | $165,000 | $122,100 |
Source: Public Records
Map
Nearby Homes