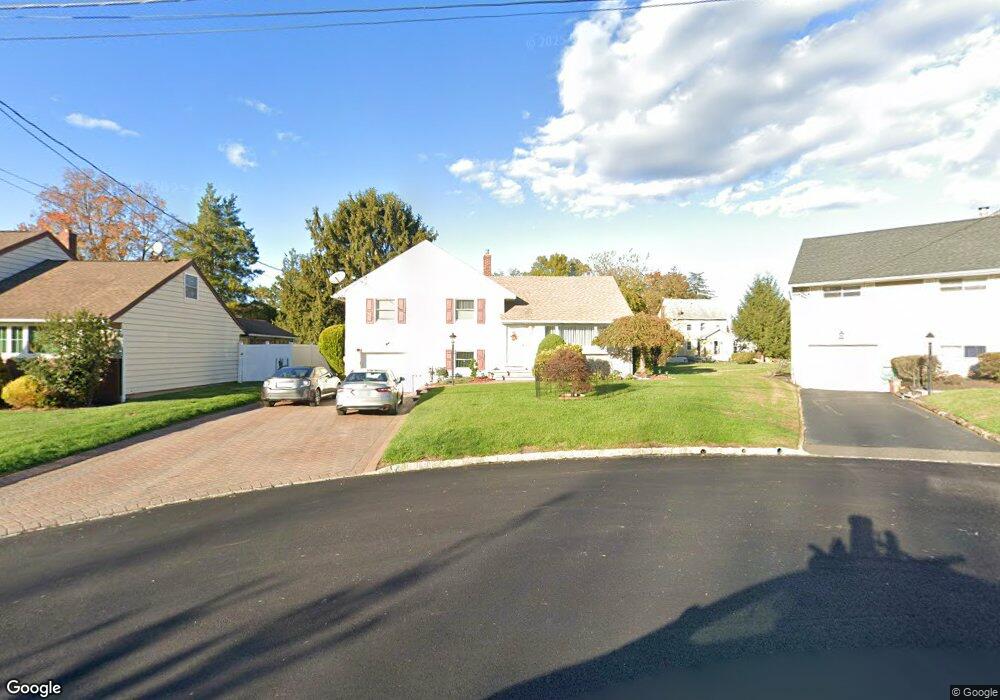
70 Grissing Ct Cedar Grove, NJ 07009
Estimated Value: $671,000 - $733,000
--
Bed
--
Bath
1,596
Sq Ft
$443/Sq Ft
Est. Value
About This Home
This home is located at 70 Grissing Ct, Cedar Grove, NJ 07009 and is currently estimated at $706,488, approximately $442 per square foot. 70 Grissing Ct is a home located in Essex County with nearby schools including Cedar Grove High School, St Catherine Of Siena School, and St. Cassian School.
Ownership History
Date
Name
Owned For
Owner Type
Purchase Details
Closed on
Jul 16, 2024
Sold by
Lazar Pawel and Lazar Irena
Bought by
Lazar Irena
Current Estimated Value
Purchase Details
Closed on
Jun 2, 2008
Home Financials for this Owner
Home Financials are based on the most recent Mortgage that was taken out on this home.
Original Mortgage
$180,000
Interest Rate
6.07%
Mortgage Type
Purchase Money Mortgage
Purchase Details
Closed on
Jun 8, 1995
Sold by
Iannuzzi Anthony
Bought by
Hangge Stephen
Home Financials for this Owner
Home Financials are based on the most recent Mortgage that was taken out on this home.
Original Mortgage
$168,000
Interest Rate
7.82%
Purchase Details
Closed on
Mar 12, 1993
Sold by
Iannuzzi Anthony and Iannuzzi Geraldine
Bought by
Iannuzzi Geraldine
Create a Home Valuation Report for This Property
The Home Valuation Report is an in-depth analysis detailing your home's value as well as a comparison with similar homes in the area
Home Values in the Area
Average Home Value in this Area
Purchase History
| Date | Buyer | Sale Price | Title Company |
|---|---|---|---|
| Lazar Irena | -- | Carroll Title Agency | |
| -- | $435,700 | -- | |
| Lazar Pawel | $435,650 | None Available | |
| Hangge Stephen | $210,000 | -- | |
| Iannuzzi Geraldine | -- | -- |
Source: Public Records
Mortgage History
| Date | Status | Borrower | Loan Amount |
|---|---|---|---|
| Previous Owner | Lazar Pawel | $180,000 | |
| Previous Owner | Hangge Stephen | $168,000 |
Source: Public Records
Tax History Compared to Growth
Tax History
| Year | Tax Paid | Tax Assessment Tax Assessment Total Assessment is a certain percentage of the fair market value that is determined by local assessors to be the total taxable value of land and additions on the property. | Land | Improvement |
|---|---|---|---|---|
| 2025 | $10,213 | $391,300 | $238,000 | $153,300 |
| 2024 | $10,213 | $391,300 | $238,000 | $153,300 |
| 2023 | $10,033 | $391,300 | $238,000 | $153,300 |
| 2022 | $10,033 | $391,300 | $238,000 | $153,300 |
| 2021 | $9,912 | $391,300 | $238,000 | $153,300 |
| 2020 | $10,056 | $391,300 | $238,000 | $153,300 |
| 2019 | $9,826 | $391,300 | $238,000 | $153,300 |
| 2018 | $9,376 | $391,300 | $238,000 | $153,300 |
| 2017 | $9,274 | $391,300 | $238,000 | $153,300 |
| 2016 | $8,988 | $391,300 | $238,000 | $153,300 |
| 2015 | $8,781 | $391,300 | $238,000 | $153,300 |
| 2014 | $8,601 | $391,300 | $238,000 | $153,300 |
Source: Public Records
Map
Nearby Homes