70 Harold St Roxbury, MA 02119
Washington Park NeighborhoodEstimated Value: $852,000 - $1,258,000
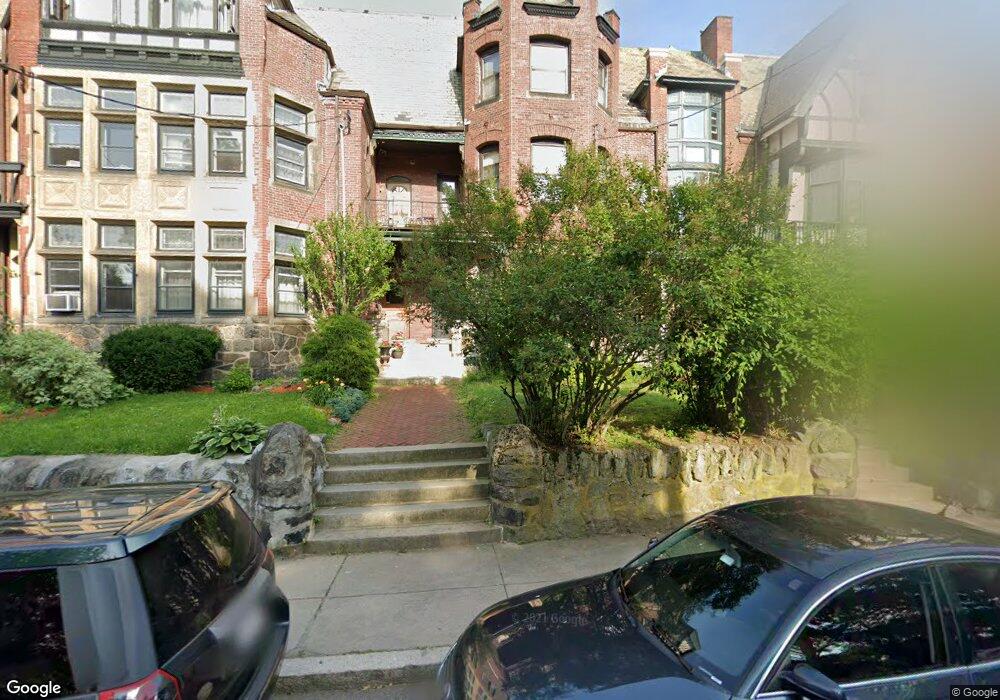
About This Home
This home is located at 70 Harold St, Roxbury, MA 02119 and is currently estimated at $1,035,144, approximately $327 per square foot. 70 Harold St is a home located in Suffolk County with nearby schools including Bridge Boston Charter School and City on a Hill Charter Public School.
Ownership History
We collect this data history from publicly available records. To have your information removed, we recommend requesting removal directly through your county’s website.
Purchase Details
Home Financials for this Owner
Home Financials are based on the most recent Mortgage that was taken out on this home.Home Values in the Area
Average Home Value in this Area
Purchase History
We collect this data history from publicly available records. To have your information removed, we recommend requesting removal directly through your county’s website.
| Date | Buyer | Sale Price | Title Company |
|---|---|---|---|
| $143,500 | -- |
Mortgage History
We collect this data history from publicly available records. To have your information removed, we recommend requesting removal directly through your county’s website.
| Date | Status | Borrower | Loan Amount |
|---|---|---|---|
| Open | $178,520 | ||
| Closed | $50,000 | ||
| Closed | $200,000 | ||
| Closed | $200,000 |
Tax History
We collect this data history from publicly available records. To have your information removed, we recommend requesting removal directly through your county’s website.
| Year | Tax Paid | Tax Assessment Tax Assessment Total Assessment is a certain percentage of the fair market value that is determined by local assessors to be the total taxable value of land and additions on the property. | Land | Improvement |
|---|---|---|---|---|
| 2025 | $8,181 | $706,500 | $198,700 | $507,800 |
| 2024 | $6,443 | $591,100 | $148,400 | $442,700 |
| 2023 | $6,348 | $591,100 | $148,400 | $442,700 |
| 2022 | $6,012 | $552,600 | $138,700 | $413,900 |
| 2021 | $5,780 | $541,700 | $136,000 | $405,700 |
| 2020 | $4,792 | $453,800 | $124,600 | $329,200 |
| 2019 | $4,469 | $424,000 | $103,600 | $320,400 |
| 2018 | $4,151 | $396,100 | $103,600 | $292,500 |
| 2017 | $4,195 | $396,100 | $103,600 | $292,500 |
| 2016 | $4,149 | $377,200 | $103,600 | $273,600 |
| 2015 | $4,661 | $384,900 | $71,700 | $313,200 |
| 2014 | $4,560 | $362,489 | $69,549 | $292,940 |
Map
- 85 Munroe St
- 14 Mayfair St
- 71 Townsend St
- 3 Laurel St
- 2856 Washington St
- 15 Codman Park
- 94 Walnut Ave
- 113 Regent St
- 287 Walnut Ave
- 178 Thornton St Unit 1
- 21 Marcella St
- 162 Humboldt Ave
- 16 Wyoming St Unit 2
- 33 Waumbeck St
- 9 W Cedar St
- 32 Hawthorne St Unit 1
- 22 Hawthorne St Unit 2
- 187 Highland St
- 34 Cobden St
- 39 Hawthorne St Unit 39
- 40 Harold St
- 30 Harold St Unit 3
- 30 Harold St Unit 2
- 30 Harold St Unit 1
- 30 Harold St Unit two
- 97 Munroe St
- 95 Munroe St
- 93 Munroe St
- 3 Harold Park
- 3 Harold Park Unit 3
- 3 Harold Park
- 3 Harold Park Unit 2
- 41 Harold St Unit 43
- 41-43 Harold St
- 41 Harold St Unit 3
- 35 Harold St Unit 1
- 35 Harold St
- 35 Harold St Unit 2
- 35 Harold St Unit 3
- 33 Harold St
Ask me questions while you tour the home.