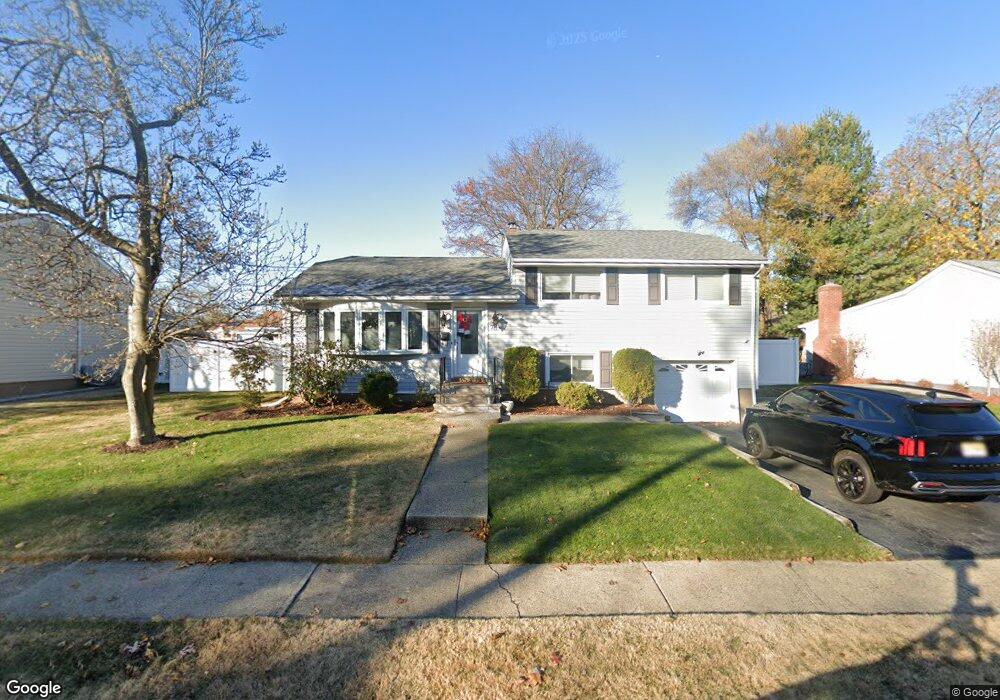
70 Harrison St Dumont, NJ 07628
Estimated Value: $728,000 - $774,000
--
Bed
--
Bath
1,508
Sq Ft
$501/Sq Ft
Est. Value
About This Home
This home is located at 70 Harrison St, Dumont, NJ 07628 and is currently estimated at $755,451, approximately $500 per square foot. 70 Harrison St is a home located in Bergen County with nearby schools including Dumont High School.
Ownership History
Date
Name
Owned For
Owner Type
Purchase Details
Closed on
Aug 18, 2017
Sold by
Ragone Jessica and Estate Of John Ragone
Bought by
Ragone Jessica
Current Estimated Value
Purchase Details
Closed on
Oct 11, 1996
Sold by
Kantor Morris
Bought by
Ragone John
Home Financials for this Owner
Home Financials are based on the most recent Mortgage that was taken out on this home.
Original Mortgage
$125,000
Interest Rate
7.75%
Create a Home Valuation Report for This Property
The Home Valuation Report is an in-depth analysis detailing your home's value as well as a comparison with similar homes in the area
Home Values in the Area
Average Home Value in this Area
Purchase History
| Date | Buyer | Sale Price | Title Company |
|---|---|---|---|
| Ragone Jessica | -- | None Available | |
| Ragone John | $147,500 | -- |
Source: Public Records
Mortgage History
| Date | Status | Borrower | Loan Amount |
|---|---|---|---|
| Previous Owner | Ragone John | $125,000 |
Source: Public Records
Tax History Compared to Growth
Tax History
| Year | Tax Paid | Tax Assessment Tax Assessment Total Assessment is a certain percentage of the fair market value that is determined by local assessors to be the total taxable value of land and additions on the property. | Land | Improvement |
|---|---|---|---|---|
| 2025 | $16,171 | $646,000 | $329,800 | $316,200 |
| 2024 | $11,395 | $397,800 | $175,700 | $222,100 |
| 2023 | $11,160 | $287,400 | $175,700 | $111,700 |
| 2022 | $11,160 | $287,400 | $175,700 | $111,700 |
| 2021 | $11,105 | $287,400 | $175,700 | $111,700 |
| 2020 | $10,803 | $287,400 | $175,700 | $111,700 |
| 2019 | $10,545 | $287,400 | $175,700 | $111,700 |
| 2018 | $9,884 | $275,000 | $175,700 | $99,300 |
| 2017 | $9,694 | $275,000 | $175,700 | $99,300 |
| 2016 | $9,468 | $275,000 | $175,700 | $99,300 |
| 2015 | $9,924 | $295,000 | $175,700 | $119,300 |
| 2014 | $9,729 | $295,000 | $175,700 | $119,300 |
Source: Public Records
Map
Nearby Homes