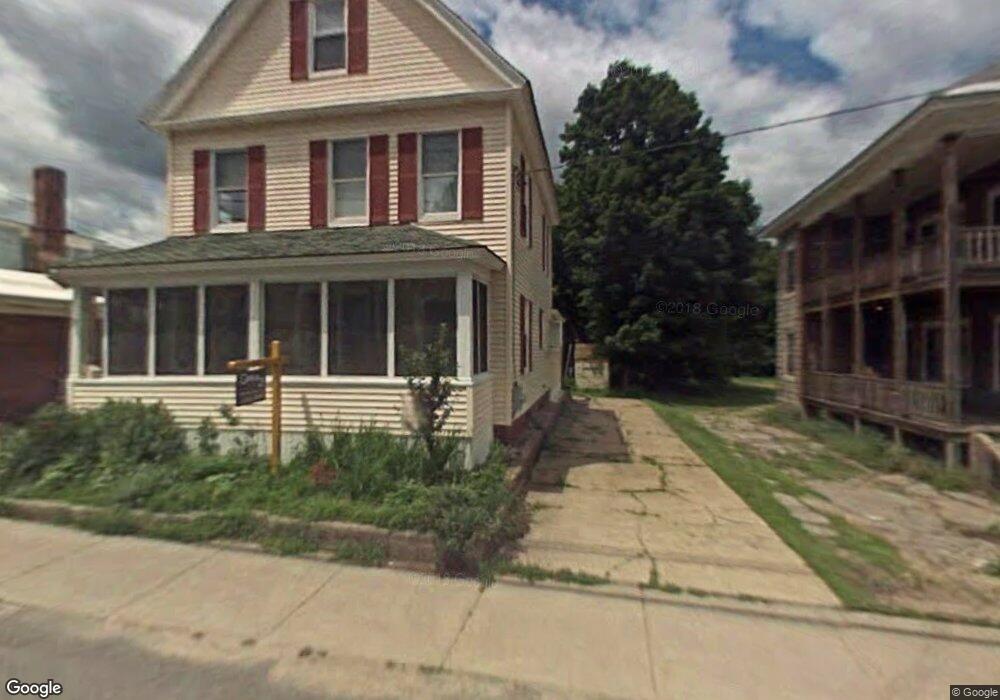
70 High St Sanford, ME 04073
Estimated Value: $329,352 - $375,000
4
Beds
2
Baths
1,915
Sq Ft
$183/Sq Ft
Est. Value
About This Home
This home is located at 70 High St, Sanford, ME 04073 and is currently estimated at $351,088, approximately $183 per square foot. 70 High St is a home located in York County with nearby schools including Sanford Christian Academy and St Thomas Consolidated School.
Ownership History
Date
Name
Owned For
Owner Type
Purchase Details
Closed on
Oct 21, 2021
Sold by
Laurie & David Llc
Bought by
Patagonia Prop Llc
Current Estimated Value
Home Financials for this Owner
Home Financials are based on the most recent Mortgage that was taken out on this home.
Original Mortgage
$1,750,000
Outstanding Balance
$1,595,837
Interest Rate
2.8%
Mortgage Type
Commercial
Estimated Equity
-$1,244,749
Purchase Details
Closed on
Aug 29, 2019
Sold by
Hsbc Bank Usa Na Tr
Bought by
Lalumiere Scott
Home Financials for this Owner
Home Financials are based on the most recent Mortgage that was taken out on this home.
Original Mortgage
$100,000
Interest Rate
3.7%
Mortgage Type
New Conventional
Purchase Details
Closed on
Jun 15, 2006
Sold by
Omeara Rita R
Bought by
Richards Laurie
Home Financials for this Owner
Home Financials are based on the most recent Mortgage that was taken out on this home.
Original Mortgage
$132,800
Interest Rate
6.62%
Mortgage Type
Purchase Money Mortgage
Create a Home Valuation Report for This Property
The Home Valuation Report is an in-depth analysis detailing your home's value as well as a comparison with similar homes in the area
Home Values in the Area
Average Home Value in this Area
Purchase History
| Date | Buyer | Sale Price | Title Company |
|---|---|---|---|
| Patagonia Prop Llc | -- | None Available | |
| Lalumiere Scott | -- | -- | |
| Richards Laurie | -- | -- |
Source: Public Records
Mortgage History
| Date | Status | Borrower | Loan Amount |
|---|---|---|---|
| Open | Patagonia Prop Llc | $1,750,000 | |
| Previous Owner | Lalumiere Scott | $100,000 | |
| Previous Owner | Richards Laurie | $132,800 |
Source: Public Records
Tax History Compared to Growth
Tax History
| Year | Tax Paid | Tax Assessment Tax Assessment Total Assessment is a certain percentage of the fair market value that is determined by local assessors to be the total taxable value of land and additions on the property. | Land | Improvement |
|---|---|---|---|---|
| 2024 | $3,614 | $223,900 | $33,400 | $190,500 |
| 2023 | $3,363 | $222,100 | $33,400 | $188,700 |
| 2022 | $3,287 | $222,100 | $33,400 | $188,700 |
| 2021 | $2,912 | $160,200 | $33,400 | $126,800 |
| 2020 | $2,895 | $143,600 | $33,400 | $110,200 |
| 2019 | $2,815 | $136,000 | $33,400 | $102,600 |
| 2018 | $2,261 | $136,000 | $33,400 | $102,600 |
| 2017 | $2,821 | $136,000 | $33,400 | $102,600 |
| 2016 | $2,526 | $111,100 | $33,400 | $77,700 |
| 2015 | $2,261 | $112,600 | $33,400 | $79,200 |
| 2014 | $2,181 | $109,200 | $33,400 | $75,800 |
| 2013 | -- | $110,900 | $33,400 | $77,500 |
Source: Public Records
Map
Nearby Homes