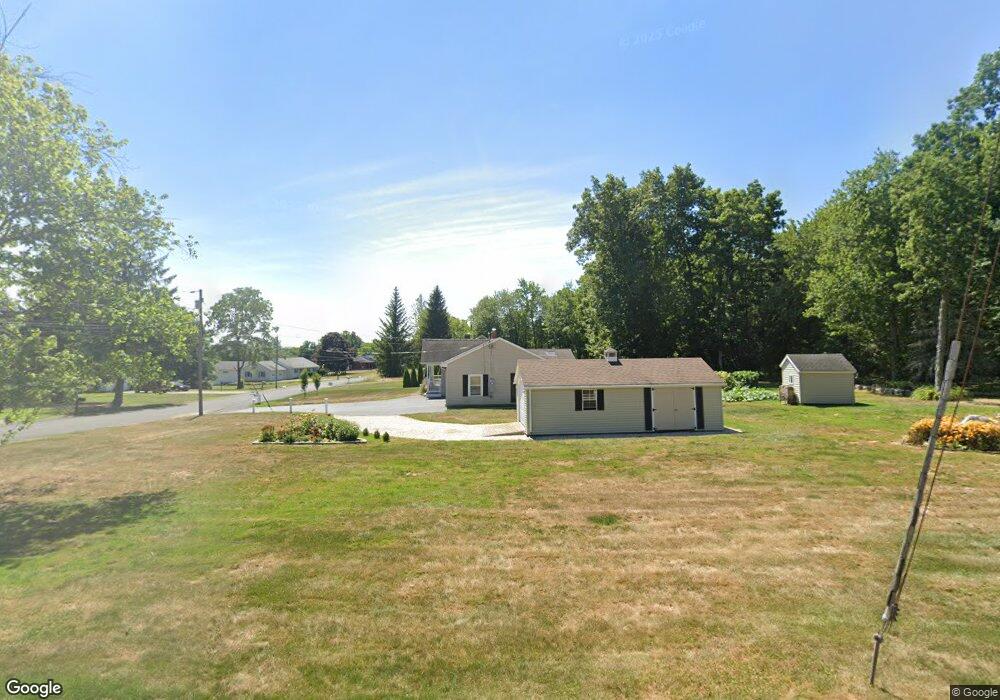
70 Homestead Rd Torrington, CT 06790
Estimated Value: $330,000 - $355,000
2
Beds
2
Baths
1,520
Sq Ft
$226/Sq Ft
Est. Value
About This Home
This home is located at 70 Homestead Rd, Torrington, CT 06790 and is currently estimated at $343,420, approximately $225 per square foot. 70 Homestead Rd is a home located in Litchfield County with nearby schools including Torrington Middle School, Torrington High School, and St. John Paul the Great Academy.
Ownership History
Date
Name
Owned For
Owner Type
Purchase Details
Closed on
Apr 28, 2025
Sold by
Roy Steven C and Roy Anne M
Bought by
Roy Steven C and Roy Anne M
Current Estimated Value
Purchase Details
Closed on
Sep 15, 2011
Sold by
Monton Deborah and Pinault Robert
Bought by
Roy Steven C and Roy Annemarie
Home Financials for this Owner
Home Financials are based on the most recent Mortgage that was taken out on this home.
Original Mortgage
$50,000
Interest Rate
4.38%
Purchase Details
Closed on
Sep 19, 2006
Sold by
Rosso Christopher S
Bought by
Monton Deborah and Pinault Robert
Purchase Details
Closed on
Oct 24, 1997
Sold by
Gromko Heather Yale and Yale Edward N
Bought by
Rosso Christopher S
Create a Home Valuation Report for This Property
The Home Valuation Report is an in-depth analysis detailing your home's value as well as a comparison with similar homes in the area
Home Values in the Area
Average Home Value in this Area
Purchase History
| Date | Buyer | Sale Price | Title Company |
|---|---|---|---|
| Roy Steven C | -- | None Available | |
| Roy Steven C | -- | None Available | |
| Roy Steven C | $240,000 | -- | |
| Roy Steven C | $240,000 | -- | |
| Monton Deborah | $230,000 | -- | |
| Monton Deborah | $230,000 | -- | |
| Rosso Christopher S | $75,000 | -- | |
| Rosso Christopher S | $75,000 | -- |
Source: Public Records
Mortgage History
| Date | Status | Borrower | Loan Amount |
|---|---|---|---|
| Previous Owner | Rosso Christopher S | $50,000 |
Source: Public Records
Tax History Compared to Growth
Tax History
| Year | Tax Paid | Tax Assessment Tax Assessment Total Assessment is a certain percentage of the fair market value that is determined by local assessors to be the total taxable value of land and additions on the property. | Land | Improvement |
|---|---|---|---|---|
| 2025 | $8,050 | $209,370 | $40,880 | $168,490 |
| 2024 | $5,483 | $114,310 | $33,520 | $80,790 |
| 2023 | $5,482 | $114,310 | $33,520 | $80,790 |
| 2022 | $5,389 | $114,310 | $33,520 | $80,790 |
| 2021 | $5,278 | $114,310 | $33,520 | $80,790 |
| 2020 | $5,278 | $114,310 | $33,520 | $80,790 |
| 2019 | $4,943 | $107,070 | $37,190 | $69,880 |
| 2018 | $4,943 | $107,070 | $37,190 | $69,880 |
| 2017 | $4,898 | $107,070 | $37,190 | $69,880 |
| 2016 | $4,898 | $107,070 | $37,190 | $69,880 |
| 2015 | $4,898 | $107,070 | $37,190 | $69,880 |
| 2014 | $5,294 | $145,760 | $62,640 | $83,120 |
Source: Public Records
Map
Nearby Homes
- 68 Westledge Terrace
- 39 Baron Ln
- 70 Greenfield Dr
- 103 Greenfield Dr
- 271 Heights Dr
- 0 Highland Ave Unit 24088105
- 130 Oakbrook Ln
- 213 Spring St
- 5 Zappulla Dr
- 361 Heights Dr
- 58 Eggleston St
- 244 Hawthorne Terrace
- 77 Chestnut Ave
- 237 Wyoming Ave
- 27 Washington Ave
- 146 Berry St
- 231 Beechwood Ave
- 136 Wyoming Ave
- 206 Martha St
- 152 Funston Ave
- 84 Homestead Rd
- 43 Kimball Ln
- 40 Homestead Rd
- 85 Homestead Rd
- 67 Homestead Rd
- 53 Homestead Rd
- 50 Kimball Ln
- 120 Homestead Rd
- 12 Homestead Rd
- 477 Allen Rd
- 130 Homestead Rd
- 111 Homestead Rd
- 387 Allen Rd
- 405 Allen Rd
- 140 Homestead Rd
- D Westledge Dr
- 00 Westledge Dr Unit 20
- 00 Westledge Dr Unit 18
- 00 Westledge Dr
- 0 Westledge Dr Unit L130725