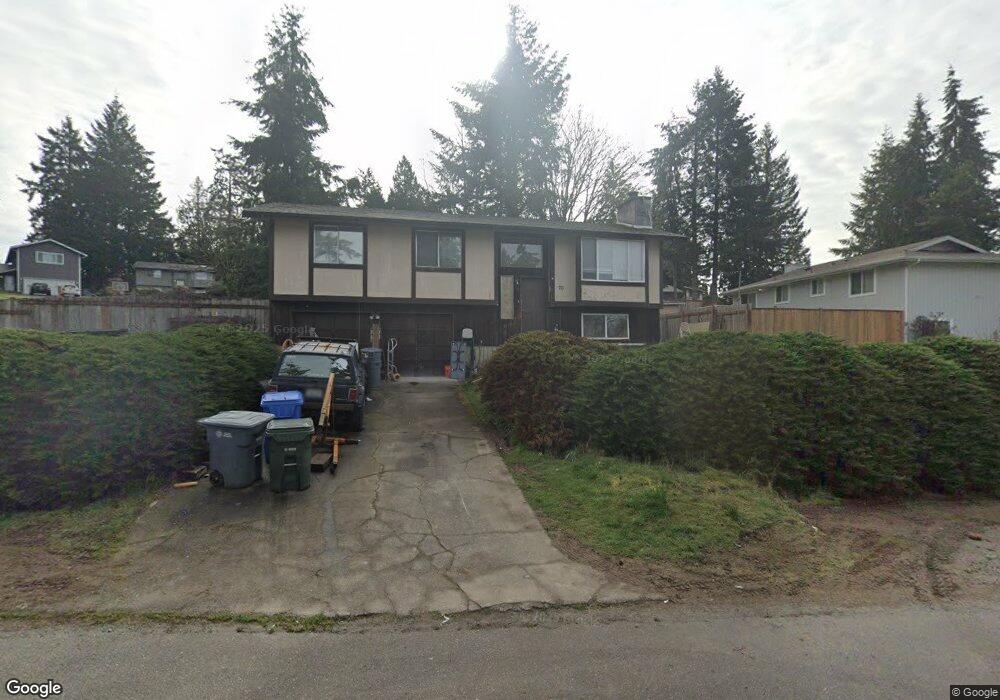
70 Hylebos Ave Milton, WA 98354
Estimated Value: $446,000 - $625,000
3
Beds
2
Baths
1,060
Sq Ft
$488/Sq Ft
Est. Value
About This Home
This home is located at 70 Hylebos Ave, Milton, WA 98354 and is currently estimated at $516,932, approximately $487 per square foot. 70 Hylebos Ave is a home located in King County with nearby schools including Discovery Primary School, Hedden Elementary School, and Surprise Lake Middle School.
Ownership History
Date
Name
Owned For
Owner Type
Purchase Details
Closed on
Sep 28, 2005
Sold by
Sprague Scott
Bought by
Sprague Scott C and Sprague Jamie R
Current Estimated Value
Home Financials for this Owner
Home Financials are based on the most recent Mortgage that was taken out on this home.
Original Mortgage
$202,746
Outstanding Balance
$108,245
Interest Rate
5.72%
Mortgage Type
FHA
Estimated Equity
$408,687
Purchase Details
Closed on
Jan 10, 2000
Sold by
Sprague Jamie
Bought by
Sprague Scott
Purchase Details
Closed on
Sep 23, 1996
Sold by
Cyphers Philip M
Bought by
Sprague Scott and Sprague Jamie
Home Financials for this Owner
Home Financials are based on the most recent Mortgage that was taken out on this home.
Original Mortgage
$78,000
Interest Rate
7.87%
Create a Home Valuation Report for This Property
The Home Valuation Report is an in-depth analysis detailing your home's value as well as a comparison with similar homes in the area
Home Values in the Area
Average Home Value in this Area
Purchase History
We collect this data history from publicly available records. To have your information removed, we recommend requesting removal directly through your county’s website.
| Date | Buyer | Sale Price | Title Company |
|---|---|---|---|
| Sprague Scott C | -- | Stewart Title | |
| Sprague Scott | -- | Commonwealth Land Title | |
| Sprague Scott | $120,000 | Commonwealth Land Title Ins |
Source: Public Records
Mortgage History
We collect this data history from publicly available records. To have your information removed, we recommend requesting removal directly through your county’s website.
| Date | Status | Borrower | Loan Amount |
|---|---|---|---|
| Open | Sprague Scott C | $202,746 | |
| Closed | Sprague Scott | $78,000 | |
| Closed | Sprague Scott | $49,061 |
Source: Public Records
Tax History
| Year | Tax Paid | Tax Assessment Tax Assessment Total Assessment is a certain percentage of the fair market value that is determined by local assessors to be the total taxable value of land and additions on the property. | Land | Improvement |
|---|---|---|---|---|
| 2024 | $4,671 | $441,000 | $150,000 | $291,000 |
| 2023 | $4,719 | $404,000 | $130,000 | $274,000 |
| 2022 | $4,237 | $436,000 | $139,000 | $297,000 |
| 2021 | $3,917 | $343,000 | $113,000 | $230,000 |
| 2020 | $3,794 | $289,000 | $100,000 | $189,000 |
| 2018 | $3,048 | $264,000 | $100,000 | $164,000 |
| 2017 | $2,480 | $238,000 | $78,000 | $160,000 |
| 2016 | $2,467 | $204,000 | $78,000 | $126,000 |
| 2015 | $2,384 | $201,000 | $78,000 | $123,000 |
| 2014 | -- | $189,000 | $78,000 | $111,000 |
| 2013 | -- | $156,000 | $75,000 | $81,000 |
Source: Public Records
Map
Nearby Homes
- 1705 Alder St
- 1311 Alder St
- 37815 21st Ct S
- 37920 21st Place S
- 2000 Birch Ct
- 414 Comet St
- 1901 Comet Ct
- 37434 18th Ave S
- 31000 18th Ave S
- 37541 21st Ave S
- 2500 Alder St Unit 304
- 2500 Alder St Unit 108
- 2500 Alder St Unit 22
- 508 19th Ave
- 2321 Alder St
- 1214 Hemlock St
- 504 10th Ave
- 411 25th Avenue Place
- 37702 27th Place S
- 37114 22nd Ave S
- 74 17th Ave
- 76 17th Ave
- 1702 Douglas Ct
- 58 Hylebos Ave
- 73R Hylebos Ave
- 71 Hylebos Ave
- 67 Hylebos Ave
- 78 17th Ave
- 1704 Douglas Ct
- 73 Hylebos Ave
- 1703 Douglas Ct
- 1703 Douglas Ct Unit 98354
- 75 17th Ave
- 65 Hylebos Ave
- 1703 Cypress Ct
- 77 17th Ave
- 1706 Douglas Ct
- 1705 Douglas Ct
- 75 Hylebos Ave
- 56 Hylebos Ave
Your Personal Tour Guide
Ask me questions while you tour the home.