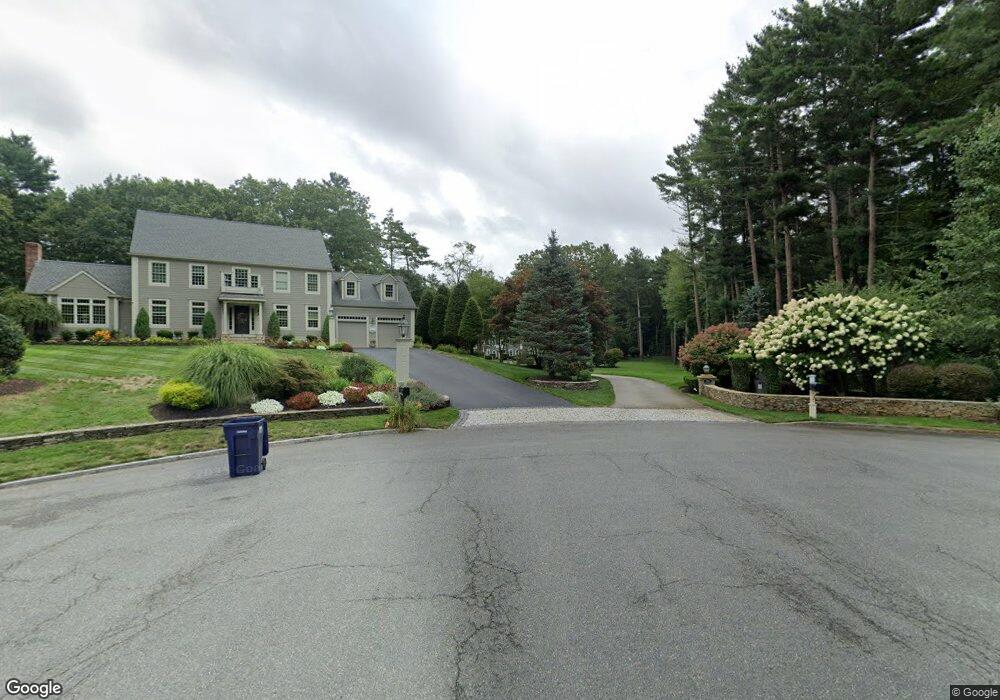
70 Jays Ln Hanover, MA 02339
Estimated Value: $1,163,000 - $1,743,000
4
Beds
4
Baths
3,679
Sq Ft
$396/Sq Ft
Est. Value
About This Home
This home is located at 70 Jays Ln, Hanover, MA 02339 and is currently estimated at $1,458,391, approximately $396 per square foot. 70 Jays Ln is a home located in Plymouth County with nearby schools including Hanover High School, Cadence Academy Preschool - Hanover, and The Master's Academy.
Ownership History
Date
Name
Owned For
Owner Type
Purchase Details
Closed on
Dec 1, 2000
Sold by
Rossi Jason S
Bought by
Katilus J Christopher and Presti Marie
Current Estimated Value
Home Financials for this Owner
Home Financials are based on the most recent Mortgage that was taken out on this home.
Original Mortgage
$350,000
Interest Rate
7.76%
Mortgage Type
Purchase Money Mortgage
Create a Home Valuation Report for This Property
The Home Valuation Report is an in-depth analysis detailing your home's value as well as a comparison with similar homes in the area
Home Values in the Area
Average Home Value in this Area
Purchase History
| Date | Buyer | Sale Price | Title Company |
|---|---|---|---|
| Katilus J Christopher | $650,000 | -- |
Source: Public Records
Mortgage History
| Date | Status | Borrower | Loan Amount |
|---|---|---|---|
| Open | Katilus J Christopher | $400,000 | |
| Closed | Katilus J Christopher | $350,000 |
Source: Public Records
Tax History Compared to Growth
Tax History
| Year | Tax Paid | Tax Assessment Tax Assessment Total Assessment is a certain percentage of the fair market value that is determined by local assessors to be the total taxable value of land and additions on the property. | Land | Improvement |
|---|---|---|---|---|
| 2025 | $16,680 | $1,350,600 | $387,600 | $963,000 |
| 2024 | $16,130 | $1,256,200 | $387,600 | $868,600 |
| 2023 | $15,874 | $1,176,700 | $356,000 | $820,700 |
| 2022 | $14,597 | $957,200 | $317,800 | $639,400 |
| 2021 | $14,645 | $896,800 | $292,400 | $604,400 |
| 2020 | $14,183 | $869,600 | $292,400 | $577,200 |
| 2019 | $14,027 | $854,800 | $315,600 | $539,200 |
| 2018 | $15,621 | $800,400 | $315,600 | $484,800 |
| 2017 | $13,464 | $815,000 | $313,600 | $501,400 |
| 2016 | $13,119 | $778,100 | $288,300 | $489,800 |
| 2015 | $12,566 | $778,100 | $288,300 | $489,800 |
Source: Public Records
Map
Nearby Homes
- 265 Silver St
- 14 Longwood Ln Unit 14
- 62 Larchmont Ln
- 85 Grove St
- 53 Chestnut St
- 250 Center St
- 51 Cervelli Farm Dr
- 37 Dr
- 23 Cervelli Farm Dr
- 38 Cervelli Farm Dr
- 9 Cervelli Farm Dr
- 8 Old Farm Rd
- 26 Church St
- 20 Meadow Brook Rd
- 186 Elm St
- 180 Elm St
- 276 Woodland Dr
- 107 Wildcat Ln
- 114 Graham Hill Dr
- 436 Center St