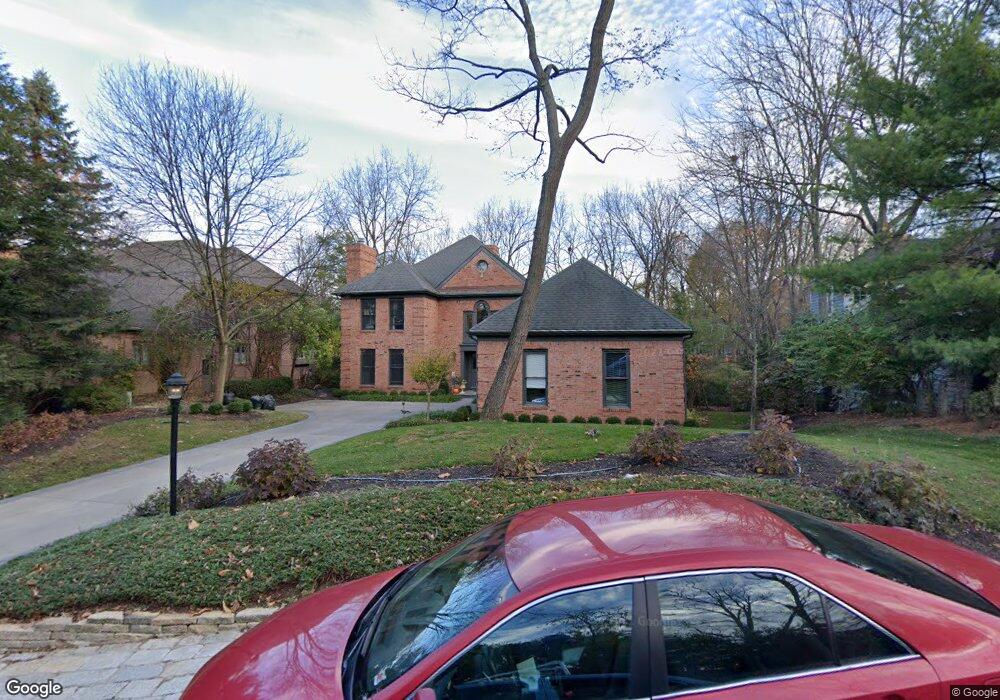
70 Kenyon Brook Dr Worthington, OH 43085
Estimated Value: $1,195,000 - $1,418,000
4
Beds
5
Baths
5,500
Sq Ft
$238/Sq Ft
Est. Value
About This Home
This home is located at 70 Kenyon Brook Dr, Worthington, OH 43085 and is currently estimated at $1,307,055, approximately $237 per square foot. 70 Kenyon Brook Dr is a home located in Franklin County with nearby schools including Colonial Hills Elementary School, Kilbourne Middle School, and Thomas Worthington High School.
Ownership History
Date
Name
Owned For
Owner Type
Purchase Details
Closed on
Jul 30, 2010
Sold by
Smith Richard M and Smith Marianne O
Bought by
Klebanoff Mark and Keim Sarah
Current Estimated Value
Home Financials for this Owner
Home Financials are based on the most recent Mortgage that was taken out on this home.
Original Mortgage
$417,000
Interest Rate
4.6%
Mortgage Type
New Conventional
Purchase Details
Closed on
Mar 30, 2006
Sold by
Williams Jacqueline T
Bought by
Smith Richard M and Smith Marianne O
Home Financials for this Owner
Home Financials are based on the most recent Mortgage that was taken out on this home.
Original Mortgage
$392,000
Interest Rate
6.5%
Mortgage Type
Fannie Mae Freddie Mac
Purchase Details
Closed on
Nov 1, 2002
Sold by
Mccullough Williams Iii
Bought by
Williams Jacqueline T
Purchase Details
Closed on
Aug 4, 1992
Bought by
Williams Mccullough
Purchase Details
Closed on
Oct 30, 1989
Purchase Details
Closed on
Jun 24, 1988
Create a Home Valuation Report for This Property
The Home Valuation Report is an in-depth analysis detailing your home's value as well as a comparison with similar homes in the area
Home Values in the Area
Average Home Value in this Area
Purchase History
| Date | Buyer | Sale Price | Title Company |
|---|---|---|---|
| Klebanoff Mark | $567,500 | Independent | |
| Smith Richard M | $492,000 | None Available | |
| Williams Jacqueline T | -- | -- | |
| Williams Mccullough | $345,000 | -- | |
| -- | -- | -- | |
| -- | $60,000 | -- |
Source: Public Records
Mortgage History
| Date | Status | Borrower | Loan Amount |
|---|---|---|---|
| Closed | Klebanoff Mark | $417,000 | |
| Closed | Smith Richard M | $392,000 |
Source: Public Records
Tax History Compared to Growth
Tax History
| Year | Tax Paid | Tax Assessment Tax Assessment Total Assessment is a certain percentage of the fair market value that is determined by local assessors to be the total taxable value of land and additions on the property. | Land | Improvement |
|---|---|---|---|---|
| 2024 | $22,458 | $353,890 | $94,500 | $259,390 |
| 2023 | $21,507 | $353,885 | $94,500 | $259,385 |
| 2022 | $20,106 | $264,360 | $22,750 | $241,610 |
| 2021 | $17,082 | $242,900 | $22,750 | $220,150 |
| 2020 | $16,472 | $242,900 | $22,750 | $220,150 |
| 2019 | $14,458 | $192,960 | $22,750 | $170,210 |
| 2018 | $14,080 | $192,960 | $22,750 | $170,210 |
| 2017 | $13,568 | $192,960 | $22,750 | $170,210 |
| 2016 | $14,139 | $193,520 | $50,020 | $143,500 |
| 2015 | $14,141 | $193,520 | $50,020 | $143,500 |
| 2014 | $14,137 | $193,520 | $50,020 | $143,500 |
| 2013 | $6,395 | $175,910 | $45,465 | $130,445 |
Source: Public Records
Map
Nearby Homes
- 5584 Morning St
- 5778 Crescent Ct
- 153 Chase Rd
- 5818 Crescent Ct
- 5542 Emerson Ave
- 5508 Emerson Ave
- 5935 N High St Unit 221
- 292 Chase Rd
- 105 W Lincoln Ave
- 382 Park Blvd
- 87 Charleston Ave
- 131 Broad Meadows Blvd
- 123 W South St
- 162 Broad Meadows Blvd
- 264 E South St
- 33 Rosslyn Ave
- 285 Pinney Dr
- 262 W South St
- 301 W Riverglen Dr
- 510 Kenbrook Dr
- 80 Kenyon Brook Dr
- 66 Kenyon Brook Dr
- 90 Kenyon Brook Dr
- 143 Lake Ridge Dr
- 155 Lake Ridge Dr
- 3 Kenyon Brook Dr
- 50 Kenyon Brook Dr
- 143 Lake Ridge Rd
- 45 Kenyon Brook Dr
- 60 Kenyon Brook Dr
- 100 Kenyon Brook Dr
- 167 Lake Ridge Dr
- 35 Kenyon Brook Dr
- 30 Kenyon Brook Dr
- 110 Kenyon Brook Dr
- 128 Lake Ridge Dr
- 5713 Bromley Ave
- 179 Lake Ridge Rd
- 179 Lake Ridge Dr
- 0 Bromley Ave