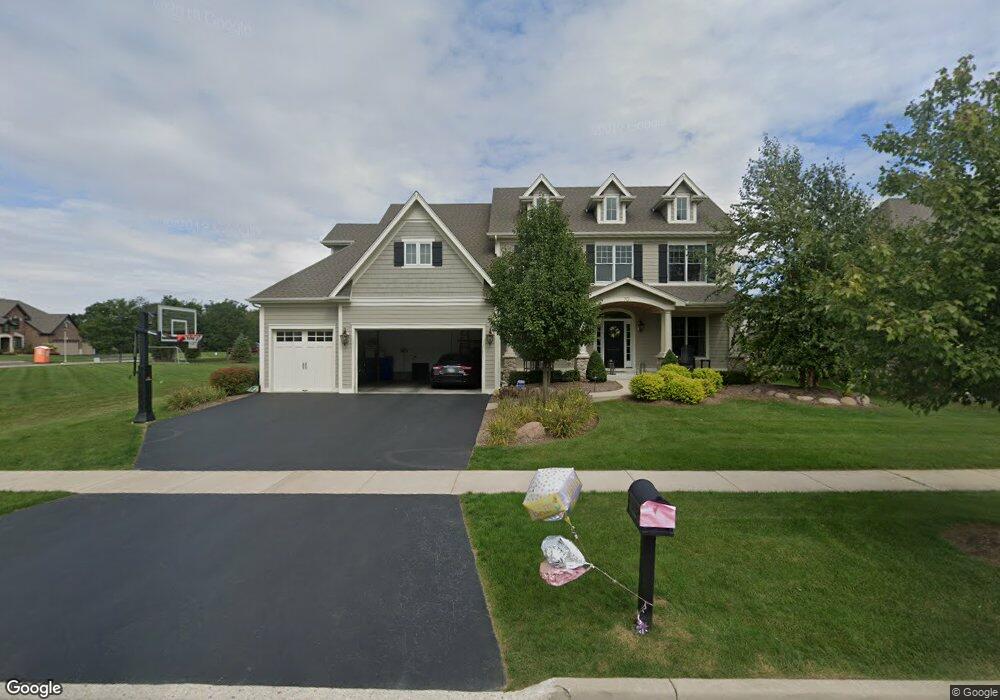
70 Landon Cir Wheaton, IL 60189
Arrowhead NeighborhoodEstimated Value: $1,114,000 - $1,248,218
Studio
1
Bath
3,833
Sq Ft
$316/Sq Ft
Est. Value
About This Home
This home is located at 70 Landon Cir, Wheaton, IL 60189 and is currently estimated at $1,211,055, approximately $315 per square foot. 70 Landon Cir is a home with nearby schools including Wiesbrook Elementary School, Hubble Middle School, and Wheaton Warrenville South High School.
Ownership History
Date
Name
Owned For
Owner Type
Purchase Details
Closed on
Aug 1, 2013
Sold by
Keim Amberwood Estates Llc
Bought by
Grant Jonathan P and Grant Amy P
Current Estimated Value
Home Financials for this Owner
Home Financials are based on the most recent Mortgage that was taken out on this home.
Original Mortgage
$627,518
Outstanding Balance
$429,336
Interest Rate
2.5%
Mortgage Type
Adjustable Rate Mortgage/ARM
Estimated Equity
$781,719
Purchase Details
Closed on
Apr 27, 2011
Sold by
Clark Street Holdings Llc Series 3 Amber
Bought by
Keim Amberwood Estates Llc
Purchase Details
Closed on
Aug 26, 2010
Sold by
Lasalle 115 Holdings Llc Series 11 Amber
Bought by
Clark Street Holdings Llc Series 3 Amber
Purchase Details
Closed on
May 19, 2010
Sold by
Wheaton Development Group Llc
Bought by
Lasalle 115 Holdings Llc Series 11 Amber and Harris Na
Create a Home Valuation Report for This Property
The Home Valuation Report is an in-depth analysis detailing your home's value as well as a comparison with similar homes in the area
Home Values in the Area
Average Home Value in this Area
Purchase History
| Date | Buyer | Sale Price | Title Company |
|---|---|---|---|
| Grant Jonathan P | $785,000 | Chicago Title Insurance Comp | |
| Keim Amberwood Estates Llc | $4,080,000 | Ctic | |
| Clark Street Holdings Llc Series 3 Amber | -- | None Available | |
| Lasalle 115 Holdings Llc Series 11 Amber | -- | None Available |
Source: Public Records
Mortgage History
| Date | Status | Borrower | Loan Amount |
|---|---|---|---|
| Open | Grant Jonathan P | $627,518 |
Source: Public Records
Tax History
| Year | Tax Paid | Tax Assessment Tax Assessment Total Assessment is a certain percentage of the fair market value that is determined by local assessors to be the total taxable value of land and additions on the property. | Land | Improvement |
|---|---|---|---|---|
| 2024 | $24,346 | $391,560 | $36,970 | $354,590 |
| 2023 | $23,454 | $360,420 | $34,030 | $326,390 |
| 2022 | $22,823 | $335,560 | $32,160 | $303,400 |
| 2021 | $22,761 | $327,600 | $31,400 | $296,200 |
| 2020 | $22,194 | $324,550 | $31,110 | $293,440 |
| 2019 | $21,580 | $315,990 | $30,290 | $285,700 |
| 2018 | $20,114 | $292,070 | $74,420 | $217,650 |
| 2017 | $19,833 | $281,290 | $71,670 | $209,620 |
| 2016 | $19,591 | $263,870 | $68,810 | $195,060 |
| 2015 | $19,468 | $250,260 | $65,650 | $184,610 |
| 2014 | $20,738 | $261,760 | $65,200 | $196,560 |
| 2013 | $1,717 | $21,800 | $21,800 | $0 |
Source: Public Records
Map
Nearby Homes
- 141 Loretto Ct
- 76 Somerset Cir
- 1605 Burning Trail
- 1620 Hemstock Ave
- 1601 W Wiesbrook Rd
- 1612 Stonebridge Trail
- 24 Winners Cup Cir Unit 3
- 1127 Hibbard Rd
- 2552 Weatherbee Ln
- Lot 1 Foothill Dr
- 2043 Spring Green Dr
- 1533 S County Farm Rd Unit 1-4
- 1028 Lodalia Ct
- 1442 Stonebridge Cir Unit I8
- 1462 Stonebridge Cir Unit F10
- 1245 Josiah Rd
- 3S700 Delles Rd
- 1S728 Shaffner Rd
- 1S710 Shaffner Rd
- 1110 S Gables Blvd
Your Personal Tour Guide
Ask me questions while you tour the home.