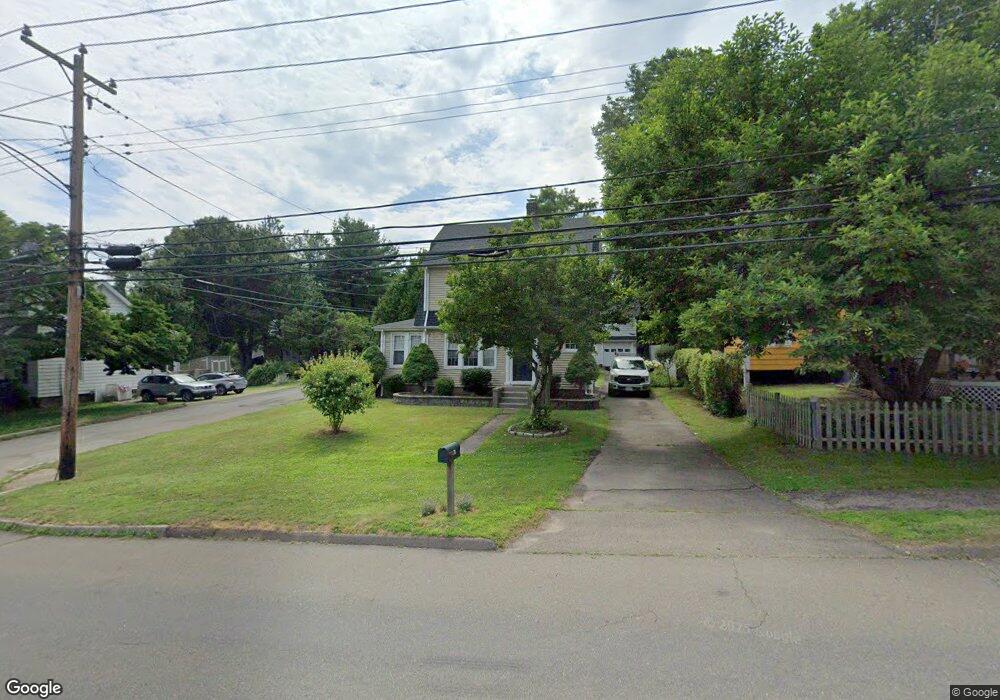
70 Laurel St East Haven, CT 06512
Estimated Value: $335,952 - $392,000
3
Beds
2
Baths
1,296
Sq Ft
$277/Sq Ft
Est. Value
About This Home
This home is located at 70 Laurel St, East Haven, CT 06512 and is currently estimated at $358,738, approximately $276 per square foot. 70 Laurel St is a home located in New Haven County with nearby schools including East Haven High School, Cold Spring School, and Pathway School.
Ownership History
Date
Name
Owned For
Owner Type
Purchase Details
Closed on
Jun 6, 2020
Sold by
Page Lawrence
Bought by
Page Lawrence and Page Robin
Current Estimated Value
Purchase Details
Closed on
Jun 2, 2020
Sold by
Winnat Robin
Bought by
7 Henry Street Llc
Purchase Details
Closed on
May 3, 2002
Sold by
Tuttle John E and Tuttle Josephine
Bought by
Page Lawrence W
Home Financials for this Owner
Home Financials are based on the most recent Mortgage that was taken out on this home.
Original Mortgage
$126,100
Interest Rate
7.13%
Purchase Details
Closed on
Aug 9, 1996
Sold by
Fusco Craig and Fusco Michelle
Bought by
Uttle John E and Tuttle Josephine M
Purchase Details
Closed on
Oct 11, 1994
Sold by
Nicholls Frank and Nicholls Marilyn M
Bought by
Fusco Craig and Boucher Michelle
Create a Home Valuation Report for This Property
The Home Valuation Report is an in-depth analysis detailing your home's value as well as a comparison with similar homes in the area
Home Values in the Area
Average Home Value in this Area
Purchase History
| Date | Buyer | Sale Price | Title Company |
|---|---|---|---|
| Page Lawrence | -- | None Available | |
| 7 Henry Street Llc | -- | None Available | |
| Page Lawrence W | $157,700 | -- | |
| Uttle John E | $104,000 | -- | |
| Fusco Craig | $105,000 | -- |
Source: Public Records
Mortgage History
| Date | Status | Borrower | Loan Amount |
|---|---|---|---|
| Previous Owner | Fusco Craig | $11,000 | |
| Previous Owner | Fusco Craig | $140,000 | |
| Previous Owner | Fusco Craig | $126,100 |
Source: Public Records
Tax History Compared to Growth
Tax History
| Year | Tax Paid | Tax Assessment Tax Assessment Total Assessment is a certain percentage of the fair market value that is determined by local assessors to be the total taxable value of land and additions on the property. | Land | Improvement |
|---|---|---|---|---|
| 2025 | $4,703 | $140,630 | $37,520 | $103,110 |
| 2024 | $4,703 | $140,630 | $37,520 | $103,110 |
| 2023 | $4,388 | $140,630 | $37,520 | $103,110 |
| 2022 | $4,388 | $140,630 | $37,520 | $103,110 |
| 2021 | $4,044 | $118,060 | $34,790 | $83,270 |
| 2020 | $4,044 | $118,060 | $34,790 | $83,270 |
| 2019 | $3,828 | $118,060 | $34,790 | $83,270 |
| 2018 | $3,229 | $99,520 | $34,790 | $64,730 |
| 2017 | $3,140 | $99,520 | $34,790 | $64,730 |
| 2016 | $3,668 | $116,270 | $43,870 | $72,400 |
| 2015 | $3,668 | $116,270 | $43,870 | $72,400 |
| 2014 | $3,726 | $116,270 | $43,870 | $72,400 |
Source: Public Records
Map
Nearby Homes
- 20 Weber St
- 111 & 111A Laurel St
- 237 N High St
- 93 Kimberly Ave
- 47 Guilford Ct
- 300 Bradley St
- 17 Guilford Ct
- 71 High St
- 364 Main St Unit 47
- 23 Pondview Terrace
- 103 Saltonstall Pkwy
- 48 Bishop St
- 133 Charter Oak Ave
- 14 Gerrish Ave
- 34 Hughes St
- 120 Harrington Ave
- 18 Lenox St
- 560 Bradley St
- 112 Harrington Ave
- 570 Bradley St