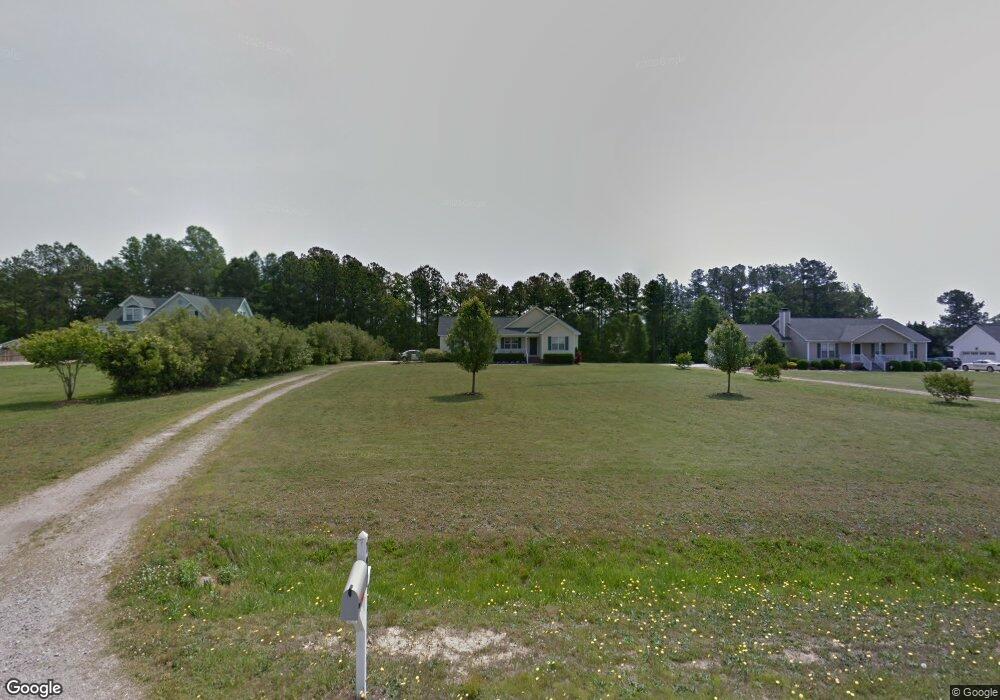
70 Leghorn Dr Zebulon, NC 27597
Estimated Value: $265,000 - $317,273
3
Beds
2
Baths
1,301
Sq Ft
$230/Sq Ft
Est. Value
About This Home
This home is located at 70 Leghorn Dr, Zebulon, NC 27597 and is currently estimated at $298,818, approximately $229 per square foot. 70 Leghorn Dr is a home located in Franklin County with nearby schools including Bunn Elementary School, Bunn Middle School, and Bunn High School.
Ownership History
Date
Name
Owned For
Owner Type
Purchase Details
Closed on
Sep 5, 2018
Sold by
Fink Kelly Ann and Walker Kelley Ann
Bought by
Faircloth Curtis D
Current Estimated Value
Home Financials for this Owner
Home Financials are based on the most recent Mortgage that was taken out on this home.
Original Mortgage
$145,000
Outstanding Balance
$127,181
Interest Rate
4.87%
Mortgage Type
Adjustable Rate Mortgage/ARM
Estimated Equity
$171,637
Purchase Details
Closed on
Nov 15, 2010
Sold by
Walker Gabriel J
Bought by
Walker Kelly Ann
Purchase Details
Closed on
Jul 30, 2008
Sold by
Williams Sherry Denise
Bought by
Walker Kelly Ann and Walker Gabriel J
Home Financials for this Owner
Home Financials are based on the most recent Mortgage that was taken out on this home.
Original Mortgage
$135,491
Interest Rate
6.37%
Mortgage Type
FHA
Purchase Details
Closed on
May 28, 2004
Bought by
Williams Sherry Denise
Create a Home Valuation Report for This Property
The Home Valuation Report is an in-depth analysis detailing your home's value as well as a comparison with similar homes in the area
Home Values in the Area
Average Home Value in this Area
Purchase History
| Date | Buyer | Sale Price | Title Company |
|---|---|---|---|
| Faircloth Curtis D | $145,000 | None Available | |
| Walker Kelly Ann | -- | None Available | |
| Walker Kelly Ann | $137,000 | None Available | |
| Williams Sherry Denise | $122,000 | -- |
Source: Public Records
Mortgage History
| Date | Status | Borrower | Loan Amount |
|---|---|---|---|
| Open | Faircloth Curtis D | $145,000 | |
| Previous Owner | Walker Kelly Ann | $135,491 |
Source: Public Records
Tax History Compared to Growth
Tax History
| Year | Tax Paid | Tax Assessment Tax Assessment Total Assessment is a certain percentage of the fair market value that is determined by local assessors to be the total taxable value of land and additions on the property. | Land | Improvement |
|---|---|---|---|---|
| 2024 | $1,739 | $288,290 | $73,500 | $214,790 |
| 2023 | $1,554 | $168,880 | $33,000 | $135,880 |
| 2022 | $1,519 | $168,880 | $33,000 | $135,880 |
| 2021 | $1,535 | $168,880 | $33,000 | $135,880 |
| 2020 | $1,545 | $168,880 | $33,000 | $135,880 |
| 2019 | $1,535 | $168,880 | $33,000 | $135,880 |
| 2018 | $1,530 | $168,880 | $33,000 | $135,880 |
| 2017 | $1,343 | $135,720 | $30,000 | $105,720 |
| 2016 | $1,390 | $135,720 | $30,000 | $105,720 |
| 2015 | $1,390 | $135,720 | $30,000 | $105,720 |
| 2014 | $1,293 | $135,720 | $30,000 | $105,720 |
Source: Public Records
Map
Nearby Homes
- 305 Leghorn Dr
- 46 Addison Pond Ct
- 45 Addison Pond Ct
- 8420 Hopkins Glen Way
- Lot 6 Triskel Ln
- Lot 5 Triskel
- 8524 Pascolo Way
- 5008 Hopkins Chapel Rd
- 25 Diamond Creek Dr
- 15 Diamond Creek Dr
- 20 Diamond Creek Dr
- 5009 Hopkins Chapel Rd
- Dunlin Plan at Kettle Creek
- Tryon Plan at Kettle Creek
- Fuller Plan at Kettle Creek
- Jasmine Plan at Kettle Creek
- Eleanor Plan at Kettle Creek
- Tundra Plan at Kettle Creek
- Sandpiper Plan at Kettle Creek
- Wisteria Plan at Kettle Creek