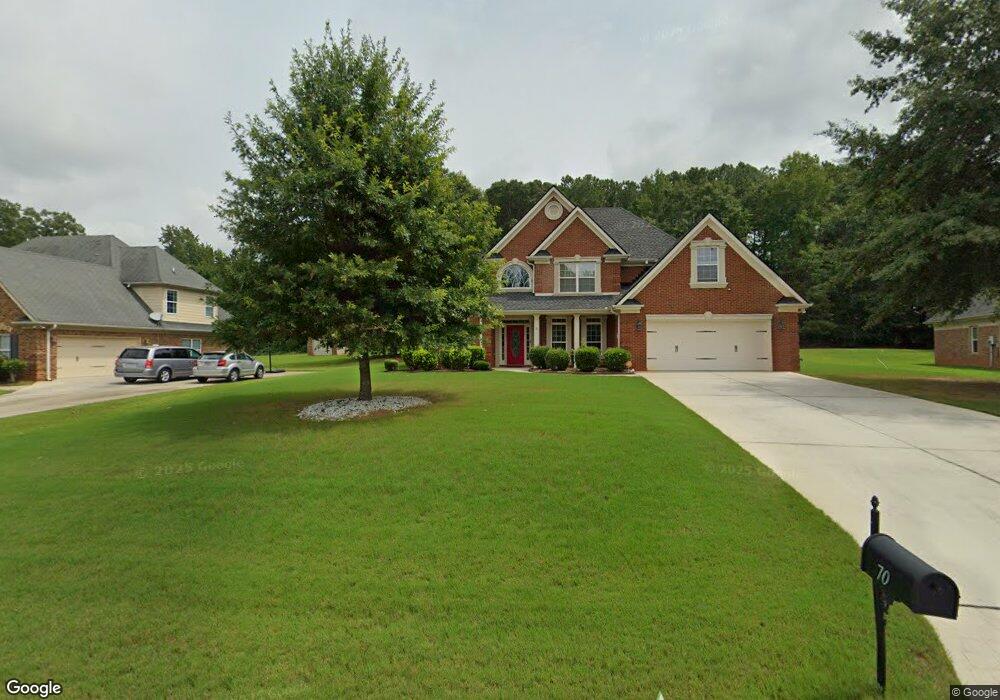
70 Logans Run Covington, GA 30016
Estimated Value: $376,096 - $450,000
Studio
2
Baths
2,667
Sq Ft
$154/Sq Ft
Est. Value
About This Home
This home is located at 70 Logans Run, Covington, GA 30016 and is currently estimated at $411,024, approximately $154 per square foot. 70 Logans Run is a home located in Newton County with nearby schools including South Salem Elementary School, Liberty Middle School, and Alcovy High School.
Ownership History
Date
Name
Owned For
Owner Type
Purchase Details
Closed on
May 13, 2009
Sold by
Federal National Mortgage Association
Bought by
Carmichael Patrick R and Carmichael Janet E
Current Estimated Value
Home Financials for this Owner
Home Financials are based on the most recent Mortgage that was taken out on this home.
Original Mortgage
$120,000
Interest Rate
4.88%
Mortgage Type
New Conventional
Purchase Details
Closed on
Feb 3, 2009
Sold by
Countrywide Hm Loans Servicing
Bought by
Federal National Mortgage Association
Purchase Details
Closed on
Oct 25, 2007
Sold by
Mathis Bldrs Inc
Bought by
Scroggins Lynn E
Home Financials for this Owner
Home Financials are based on the most recent Mortgage that was taken out on this home.
Original Mortgage
$330,000
Interest Rate
6.27%
Mortgage Type
New Conventional
Create a Home Valuation Report for This Property
The Home Valuation Report is an in-depth analysis detailing your home's value as well as a comparison with similar homes in the area
Home Values in the Area
Average Home Value in this Area
Purchase History
| Date | Buyer | Sale Price | Title Company |
|---|---|---|---|
| Carmichael Patrick R | -- | -- | |
| Federal National Mortgage Association | -- | -- | |
| Countrywide Hm Loans Servicing | $285,307 | -- | |
| Scroggins Lynn E | $330,000 | -- |
Source: Public Records
Mortgage History
| Date | Status | Borrower | Loan Amount |
|---|---|---|---|
| Previous Owner | Carmichael Patrick R | $120,000 | |
| Previous Owner | Scroggins Lynn E | $330,000 |
Source: Public Records
Tax History
| Year | Tax Paid | Tax Assessment Tax Assessment Total Assessment is a certain percentage of the fair market value that is determined by local assessors to be the total taxable value of land and additions on the property. | Land | Improvement |
|---|---|---|---|---|
| 2025 | $3,118 | $167,040 | $24,000 | $143,040 |
| 2024 | $2,960 | $155,040 | $24,000 | $131,040 |
| 2023 | $3,141 | $141,640 | $11,200 | $130,440 |
| 2022 | $2,586 | $121,160 | $11,200 | $109,960 |
| 2021 | $2,527 | $109,640 | $11,200 | $98,440 |
| 2020 | $2,209 | $92,480 | $11,200 | $81,280 |
| 2019 | $2,219 | $91,840 | $11,200 | $80,640 |
| 2018 | $1,608 | $73,640 | $8,800 | $64,840 |
| 2017 | $1,524 | $71,200 | $8,800 | $62,400 |
| 2016 | $1,335 | $65,680 | $7,200 | $58,480 |
| 2015 | $1,424 | $68,400 | $7,200 | $61,200 |
| 2014 | $1,416 | $68,400 | $0 | $0 |
Source: Public Records
Map
Nearby Homes
- 10 Logans Run
- 0 Sims Rd Unit 10713073
- 10 Oaklake Ct
- 60 Heritage Keep
- 130 Lakefront Dr
- 115 Branchwood Dr
- 10 Edgewater Ct
- 275 Roberts Rd
- 20 Crooked Creek Way
- 185 Wilson Rd
- 70 Countryside Ln
- 205 Woodcrest Dr
- 120 Woodcrest Dr
- 130 Berkshire Dr
- 25 Woodcrest Dr
- 800 Mills Dr
- 585 Cowan Rd
- 750 Mills Dr
- 7 Glynnshire Ct
- 417 Rosser Rd
- 60 Logans Run
- 80 Logans Run
- 85 Logans Run
- 75 Logans Run
- 50 Logans Run
- 90 Logans Run
- 55 Logans Run
- 95 White Oak Dr
- 85 White Oak Dr Unit 2
- 10 Ginger Way Unit 21
- 105 White Oak Dr
- 75 White Oak Dr
- 25 Logans Run
- 95 Logans Run
- 110 Logans Run
- 115 White Oak Dr Unit 2
- 65 White Oak Dr
- 105 Logans Run
- 125 White Oak Dr Unit 2
- 25 Ginger Way
Your Personal Tour Guide
Ask me questions while you tour the home.