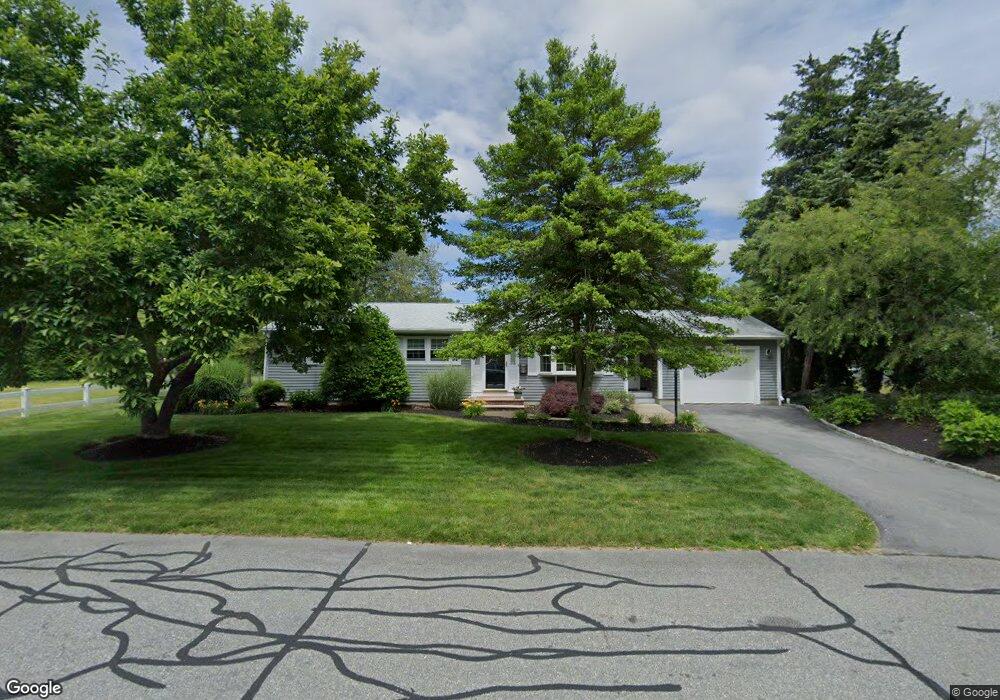
70 Longview Dr North Dartmouth, MA 02747
Smith Mills NeighborhoodEstimated Value: $456,000 - $640,000
3
Beds
2
Baths
1,652
Sq Ft
$345/Sq Ft
Est. Value
About This Home
This home is located at 70 Longview Dr, North Dartmouth, MA 02747 and is currently estimated at $569,698, approximately $344 per square foot. 70 Longview Dr is a home located in Bristol County with nearby schools including Dartmouth High School, Nazarene Christian Academy, and Friends Academy.
Ownership History
Date
Name
Owned For
Owner Type
Purchase Details
Closed on
Aug 19, 2022
Sold by
Sharp Ret and Boucher
Bought by
Janice C Sharp Ret and Sharp
Current Estimated Value
Home Financials for this Owner
Home Financials are based on the most recent Mortgage that was taken out on this home.
Original Mortgage
$125,000
Outstanding Balance
$119,182
Interest Rate
5.51%
Mortgage Type
New Conventional
Estimated Equity
$450,516
Purchase Details
Closed on
Mar 23, 2021
Sold by
Sharp Irt and Boucher
Bought by
Defrias-Hirst Mary M and Sharp
Purchase Details
Closed on
Jun 13, 2019
Sold by
Sharp Janice C
Bought by
Sharp Irt and Defrias-Hirst
Create a Home Valuation Report for This Property
The Home Valuation Report is an in-depth analysis detailing your home's value as well as a comparison with similar homes in the area
Home Values in the Area
Average Home Value in this Area
Purchase History
| Date | Buyer | Sale Price | Title Company |
|---|---|---|---|
| Janice C Sharp Ret | -- | None Available | |
| Janice C Sharp Ret | -- | None Available | |
| Defrias-Hirst Mary M | -- | None Available | |
| Janice C Sharp Ret | -- | None Available | |
| Defrias-Hirst Mary M | -- | None Available | |
| Sharp Irt | -- | -- | |
| Sharp Irt | -- | -- |
Source: Public Records
Mortgage History
| Date | Status | Borrower | Loan Amount |
|---|---|---|---|
| Open | Janice C Sharp Ret | $125,000 | |
| Closed | Janice C Sharp Ret | $125,000 |
Source: Public Records
Tax History Compared to Growth
Tax History
| Year | Tax Paid | Tax Assessment Tax Assessment Total Assessment is a certain percentage of the fair market value that is determined by local assessors to be the total taxable value of land and additions on the property. | Land | Improvement |
|---|---|---|---|---|
| 2025 | $4,140 | $457,500 | $172,800 | $284,700 |
| 2024 | $4,018 | $439,600 | $159,900 | $279,700 |
| 2023 | $3,951 | $407,700 | $154,700 | $253,000 |
| 2022 | $3,794 | $366,200 | $154,700 | $211,500 |
| 2021 | $3,716 | $343,100 | $143,900 | $199,200 |
| 2020 | $3,557 | $326,900 | $136,400 | $190,500 |
| 2019 | $3,455 | $318,400 | $130,200 | $188,200 |
| 2018 | $3,274 | $309,800 | $142,700 | $167,100 |
| 2017 | $3,179 | $298,800 | $134,600 | $164,200 |
| 2016 | $2,993 | $282,900 | $128,700 | $154,200 |
| 2015 | $2,906 | $276,500 | $120,300 | $156,200 |
| 2014 | $2,798 | $268,000 | $115,100 | $152,900 |
Source: Public Records
Map
Nearby Homes
- 46 Old Westport Rd
- 135 Old Westport Rd
- 28 Greystone Ave
- 1406 Tucker Rd
- 0 Undisclosed Unit 73376281
- 65 Cross Rd
- Lot 6 Rafael Rd
- 53 Morton Ave
- 32 Morton Ave
- 0 Mosher Ln Unit 73370974
- 310 Old Westport Rd
- 312 Old Westport Rd
- 4 Sabrinas Way
- 4 Sabrina Way Unit A
- 4 Sabrina Way Unit C
- 4 Sabrina Way Unit B
- 4 Sabrina Way Unit D
- 320 Old Westport Rd
- 219 Chase Rd
- 24 Wayne Memorial Dr
- 80 Longview Dr
- 80 Longview Dr
- 26 Longview Dr
- 64 Longview Dr
- 22 Longview Dr
- 30 Longview Dr
- 81 Longview Dr
- 16 Longview Dr
- 75 Longview Dr
- 34 Longview Dr
- 83 Longview Dr
- 27 Longview Dr
- 23 Longview Dr
- 50 Longview Dr
- 65 Longview Dr
- 84 Old Westport Rd
- 31 Longview Dr
- 19 Longview Dr
- 38 Longview Dr
- 76 Old Westport Rd