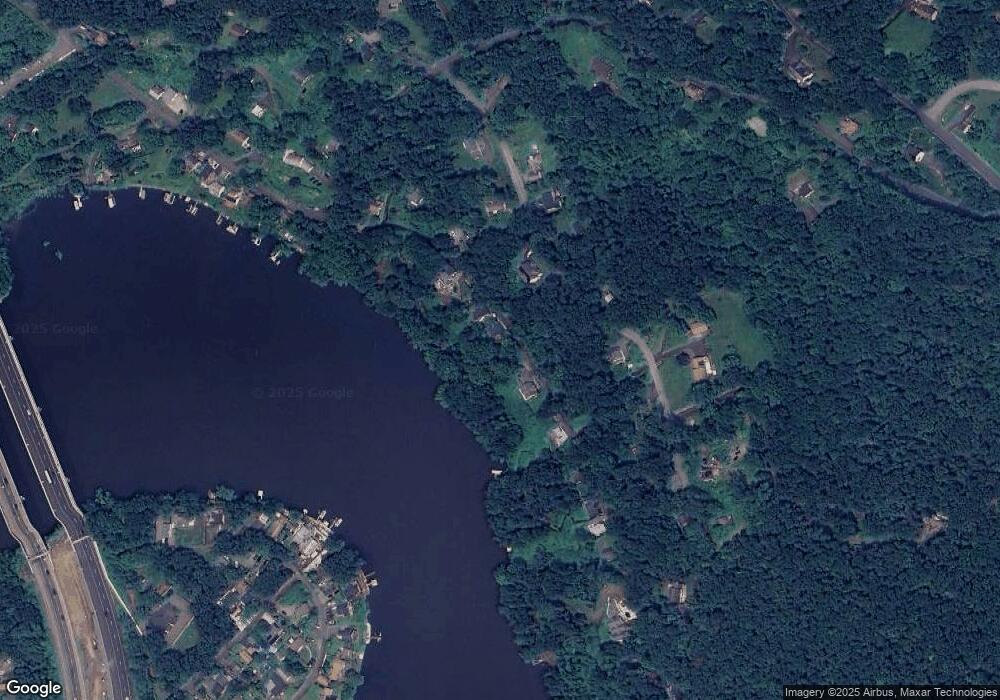
70 Lower Fish Rock Rd Southbury, CT 06488
Estimated Value: $110,000 - $300,000
2
Beds
1
Bath
792
Sq Ft
$220/Sq Ft
Est. Value
About This Home
This home is located at 70 Lower Fish Rock Rd, Southbury, CT 06488 and is currently estimated at $173,931, approximately $219 per square foot. 70 Lower Fish Rock Rd is a home located in New Haven County with nearby schools including Pomperaug Elementary School, Rochambeau Middle School, and Pomperaug Regional High School.
Ownership History
Date
Name
Owned For
Owner Type
Purchase Details
Closed on
Feb 26, 2025
Sold by
Lgc Properties Llc
Bought by
Dumond Urszula and Dumond Ryan P
Current Estimated Value
Purchase Details
Closed on
Feb 11, 2022
Sold by
Perrella Brian
Bought by
Lgl Properties Llc
Purchase Details
Closed on
Dec 8, 2017
Sold by
Jacobson Bruce W
Bought by
Perrella Brian
Purchase Details
Closed on
Aug 7, 1986
Bought by
Jacobson Bruce W
Create a Home Valuation Report for This Property
The Home Valuation Report is an in-depth analysis detailing your home's value as well as a comparison with similar homes in the area
Home Values in the Area
Average Home Value in this Area
Purchase History
| Date | Buyer | Sale Price | Title Company |
|---|---|---|---|
| Dumond Urszula | $105,000 | None Available | |
| Dumond Urszula | $105,000 | None Available | |
| Lgl Properties Llc | -- | None Available | |
| Lgl Properties Llc | -- | None Available | |
| Perrella Brian | $52,000 | -- | |
| Perrella Brian | $52,000 | -- | |
| Jacobson Bruce W | -- | -- |
Source: Public Records
Mortgage History
| Date | Status | Borrower | Loan Amount |
|---|---|---|---|
| Previous Owner | Jacobson Bruce W | $103,700 |
Source: Public Records
Tax History Compared to Growth
Tax History
| Year | Tax Paid | Tax Assessment Tax Assessment Total Assessment is a certain percentage of the fair market value that is determined by local assessors to be the total taxable value of land and additions on the property. | Land | Improvement |
|---|---|---|---|---|
| 2025 | $3,897 | $161,050 | $153,640 | $7,410 |
| 2024 | $3,801 | $161,050 | $153,640 | $7,410 |
| 2023 | $3,624 | $161,050 | $153,640 | $7,410 |
| 2022 | $2,649 | $92,490 | $91,780 | $710 |
| 2021 | $2,710 | $92,490 | $91,780 | $710 |
| 2020 | $2,710 | $92,490 | $91,780 | $710 |
| 2019 | $2,691 | $92,490 | $91,780 | $710 |
| 2018 | $2,682 | $92,490 | $91,780 | $710 |
| 2017 | $3,788 | $129,290 | $90,290 | $39,000 |
| 2016 | $3,724 | $129,290 | $90,290 | $39,000 |
| 2015 | $3,672 | $129,290 | $90,290 | $39,000 |
| 2014 | $3,568 | $129,290 | $90,290 | $39,000 |
Source: Public Records
Map
Nearby Homes
- 105 Lower Fish Rock Rd
- 54 Lake Ridge Rd
- 199 Riverside Rd
- 257 Ichabod Rd
- 105 Lake Ridge Rd
- 22 Hemlock Trail
- 147 Oakdale Manor Rd
- 102 Hillside Rd
- 215 White Birch Dr
- 338 S Georges Hill Rd
- 60 Pascoe Dr
- 301 Berkshire Rd
- 108 Riverside Rd
- 69 Engleside Terrace
- 197 Lee Farm Dr
- 203 Lee Farm Dr
- 0 Pequot Trail Unit 24124842
- 82 Lakeview Terrace
- 84 Edgelake Dr
- 41 Chipmunk Trail
- 62 Lower Fish Rock Rd
- 62 Old Fish Rock Rd
- 56 Lower Fish Rock Rd
- 86 Lower Fish Rock Rd
- 58 Upper Fish Rock Rd
- 46 Lower Fish Rock Rd
- 91 Lower Fish Rock Rd
- 90 Upper Fish Rock Rd
- 96 Lower Fish Rock Rd
- Lot 25A Upper Fish Rock Rd
- 35 Lower Fish Rock Rd
- 81 Upper Fish Rock Rd
- 50 Upper Fish Rock Rd
- 30 Lower Fish Rock Rd
- 55 Upper Fish Rock Rd
- 110 Lower Fish Rock Rd
- 120 Upper Fish Rock Rd
- 45 Upper Fish Rock Rd
- 120 Upper Fish Rock Rd
- 120 Lower Fish Rock Rd
