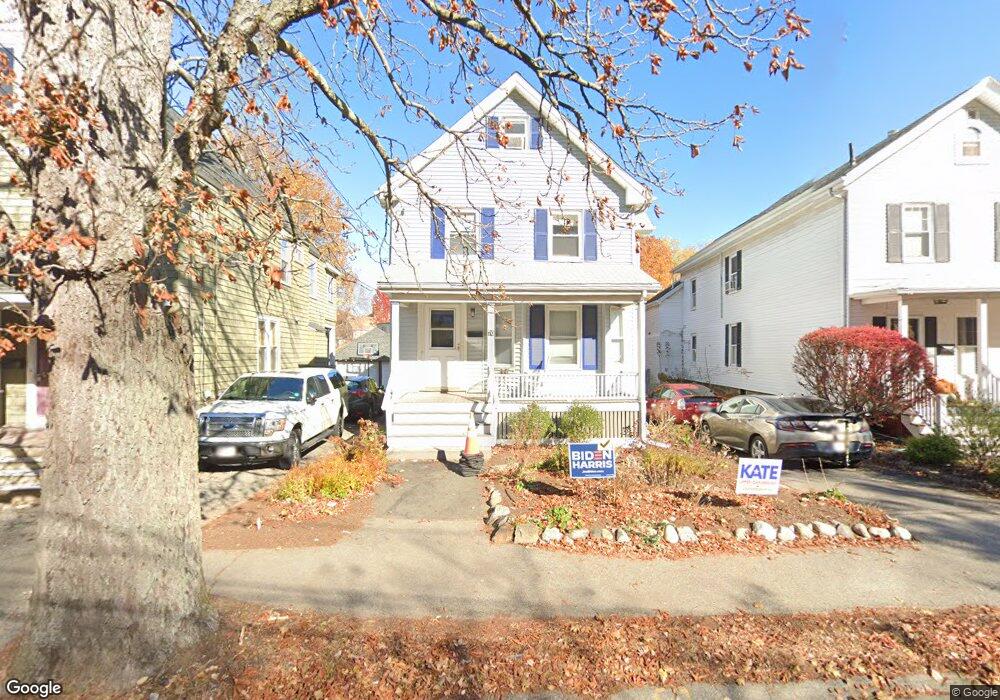
70 Lynde St Melrose, MA 02176
Oak Grove-Pine Banks NeighborhoodEstimated Value: $734,184 - $865,000
3
Beds
2
Baths
1,532
Sq Ft
$517/Sq Ft
Est. Value
About This Home
This home is located at 70 Lynde St, Melrose, MA 02176 and is currently estimated at $792,046, approximately $517 per square foot. 70 Lynde St is a home located in Middlesex County with nearby schools including Lincoln Elementary School, Winthrop Elementary School, and Hoover Elementary School.
Ownership History
Date
Name
Owned For
Owner Type
Purchase Details
Closed on
Dec 19, 2019
Sold by
Newman Howard J and Katz Ellen F
Bought by
Newman-Katz Ft
Current Estimated Value
Purchase Details
Closed on
Aug 29, 1989
Sold by
Rowe John
Bought by
Jones Matthew D
Create a Home Valuation Report for This Property
The Home Valuation Report is an in-depth analysis detailing your home's value as well as a comparison with similar homes in the area
Home Values in the Area
Average Home Value in this Area
Purchase History
| Date | Buyer | Sale Price | Title Company |
|---|---|---|---|
| Newman-Katz Ft | -- | None Available | |
| Jones Matthew D | $175,000 | -- |
Source: Public Records
Mortgage History
| Date | Status | Borrower | Loan Amount |
|---|---|---|---|
| Previous Owner | Jones Matthew D | $223,000 | |
| Previous Owner | Jones Matthew D | $230,000 | |
| Previous Owner | Jones Matthew D | $20,000 |
Source: Public Records
Tax History
| Year | Tax Paid | Tax Assessment Tax Assessment Total Assessment is a certain percentage of the fair market value that is determined by local assessors to be the total taxable value of land and additions on the property. | Land | Improvement |
|---|---|---|---|---|
| 2025 | $65 | $653,600 | $415,200 | $238,400 |
| 2024 | $6,169 | $621,200 | $388,400 | $232,800 |
| 2023 | $6,056 | $581,200 | $361,600 | $219,600 |
| 2022 | $5,913 | $559,400 | $348,200 | $211,200 |
| 2021 | $6,014 | $549,200 | $348,200 | $201,000 |
| 2020 | $5,774 | $522,500 | $321,400 | $201,100 |
| 2019 | $5,176 | $478,800 | $294,600 | $184,200 |
| 2018 | $4,856 | $428,600 | $244,400 | $184,200 |
| 2017 | $4,725 | $400,400 | $234,400 | $166,000 |
| 2016 | $4,214 | $341,800 | $200,900 | $140,900 |
| 2015 | $4,190 | $323,300 | $190,800 | $132,500 |
| 2014 | $4,072 | $306,600 | $174,100 | $132,500 |
Source: Public Records
Map
Nearby Homes
- 77 Lynde St
- 15 Cass St
- 333 Main St
- 340 Main St Unit 311
- 340 Main St Unit 206
- 534 Main St Unit 11
- 48 Malvern St Unit 2
- 71-73 Grove St
- 236-238 Main St
- 244 Main St
- 104 Cottage St
- 55 Boston Rock Rd
- 447 Pleasant St
- 37 S High St
- 62 Cottage St
- 22 E Emerson St
- 6 Colby Terrace
- 37 Clinton Rd
- 8 Crystal St Unit 2
- 8 Crystal St Unit 3
- 66 Lynde St
- 66 Lynde St Unit 1
- 66 Lynde St Unit 2
- 72 Lynde St
- 3 Grove Place
- 1 Grove Place
- 76 Lynde St
- 3 Walnut St
- 5 Walnut St
- 2 Grove Place
- 4 Grove Place
- 4 Grove Place Unit 2
- 15 Walnut St Unit 1
- 15 Walnut St
- 103 Grove St
- 109 Grove St Unit 109
- 109 Grove St
- 99 Grove St
- 73 Lynde St
- 107 Grove St Unit 109
Your Personal Tour Guide
Ask me questions while you tour the home.