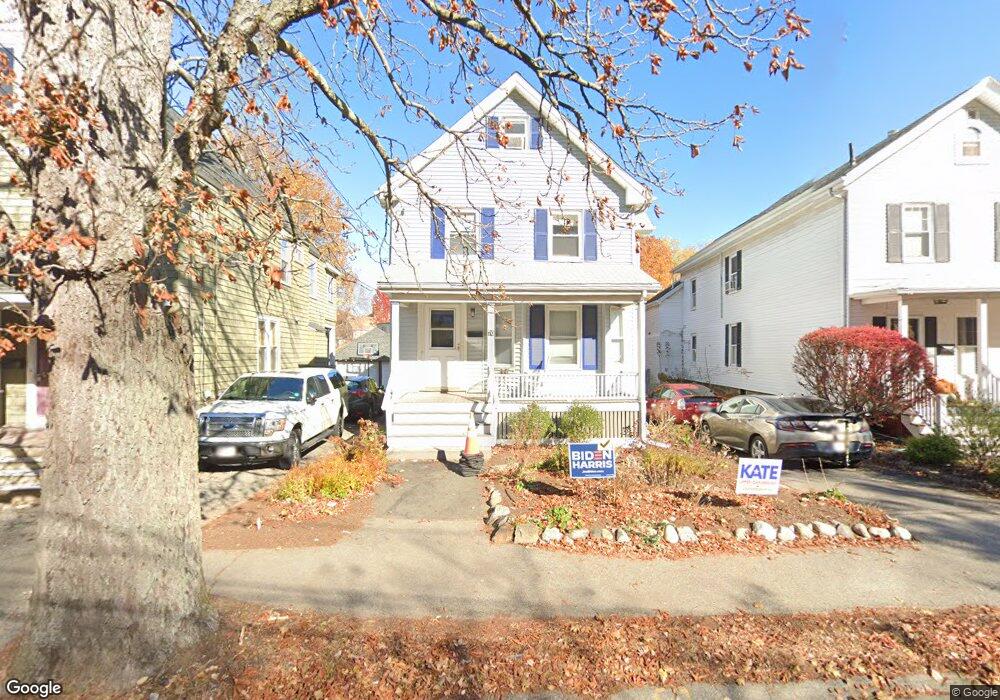
70 Lynde St Melrose, MA 02176
Oak Grove-Pine Banks NeighborhoodEstimated Value: $761,197 - $898,000
About This Home
This home is located at 70 Lynde St, Melrose, MA 02176 and is currently estimated at $828,549, approximately $540 per square foot. 70 Lynde St is a home located in Middlesex County with nearby schools including Lincoln Elementary School, Winthrop Elementary School, and Hoover Elementary School.
Ownership History
We collect this data history from publicly available records. To have your information removed, we recommend requesting removal directly through your county’s website.
Purchase Details
Purchase Details
Home Values in the Area
Average Home Value in this Area
Purchase History
We collect this data history from publicly available records. To have your information removed, we recommend requesting removal directly through your county’s website.
| Date | Buyer | Sale Price | Title Company |
|---|---|---|---|
| -- | None Available | ||
| $175,000 | -- |
Mortgage History
We collect this data history from publicly available records. To have your information removed, we recommend requesting removal directly through your county’s website.
| Date | Status | Borrower | Loan Amount |
|---|---|---|---|
| Previous Owner | $223,000 | ||
| Previous Owner | $230,000 | ||
| Previous Owner | $20,000 |
Tax History
We collect this data history from publicly available records. To have your information removed, we recommend requesting removal directly through your county’s website.
| Year | Tax Paid | Tax Assessment Tax Assessment Total Assessment is a certain percentage of the fair market value that is determined by local assessors to be the total taxable value of land and additions on the property. | Land | Improvement |
|---|---|---|---|---|
| 2025 | $65 | $653,600 | $415,200 | $238,400 |
| 2024 | $6,169 | $621,200 | $388,400 | $232,800 |
| 2023 | $6,056 | $581,200 | $361,600 | $219,600 |
| 2022 | $5,913 | $559,400 | $348,200 | $211,200 |
| 2021 | $6,014 | $549,200 | $348,200 | $201,000 |
| 2020 | $5,774 | $522,500 | $321,400 | $201,100 |
| 2019 | $5,176 | $478,800 | $294,600 | $184,200 |
| 2018 | $4,856 | $428,600 | $244,400 | $184,200 |
| 2017 | $4,725 | $400,400 | $234,400 | $166,000 |
| 2016 | $4,214 | $341,800 | $200,900 | $140,900 |
| 2015 | $4,190 | $323,300 | $190,800 | $132,500 |
| 2014 | $4,072 | $306,600 | $174,100 | $132,500 |
Map
- 2 Grove Place
- 59 Mystic Ave
- 169 Grove St
- 340 Main St Unit 301
- 340 Main St Unit 606
- 534 Main St Unit 11
- 12 Mount Vernon St Unit 25
- 15 Berwick St
- 26 W Wyoming Ave Unit 2D
- 265 Main St
- 225 Grove St
- 509 Pleasant St Unit 1-4
- 59 Beech Ave
- 26 1st St
- 38-40 Hurd St
- 143 Myrtle St
- 171 Derby Rd
- 7 Park St
- 28 Edgemere St
- 47 S High St
- 99 Grove St
- 103 Grove St
- 95 Grove St
- 95 Grove St Unit 2
- 5 Walnut St
- 15 Walnut St Unit 1
- 15 Walnut St
- 109 Grove St Unit 109
- 109 Grove St
- 107 Grove St Unit 109
- 107 Grove St Unit 107
- 3 Walnut St
- 1 Grove Place
- 96 Grove St
- 100 Grove St
- 106 Grove St Unit 108
- 106 Grove St Unit 1
- 3 Grove Place
- 66 Lynde St
- 66 Lynde St Unit 1
Ask me questions while you tour the home.