S
Seller's Agent in 2016
Sabrina Mandell
Cameron Real Estate Group
Estimated Value: $556,000 - $676,000
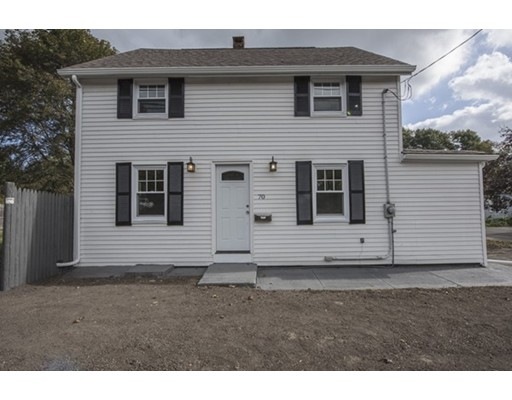
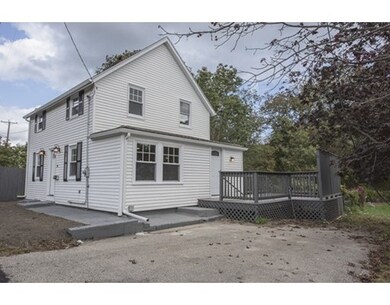
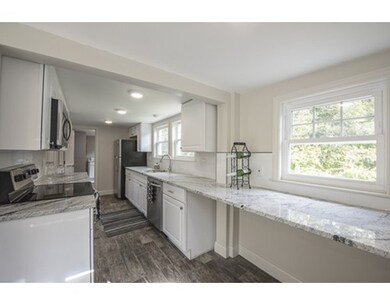
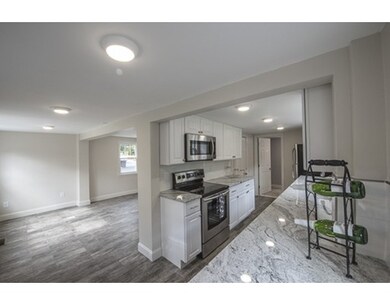
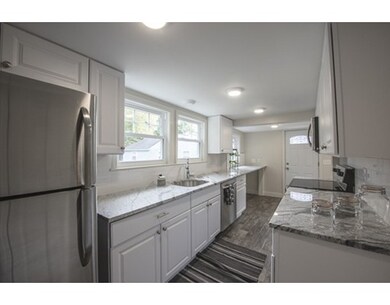
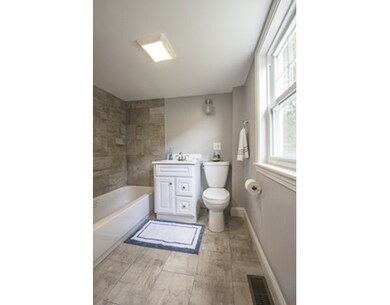
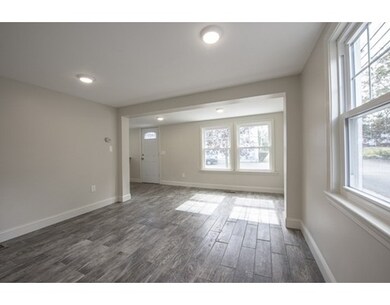
Back on Market! !NEWLY DONE: WaterGuard Basement System with a lifetime Warranty! Bright and airy updated home! Nice neighborhood and quiet street. New kitchen, granite counter tops, stainless steel appliances, new cabinets. Living/Dining room combo. New heating system and hot water heater.Open House Sunday April 10 12-1:30pm
Last Agent to Sell the Property
Sabrina Mandell
Cameron Real Estate Group Listed on: 10/06/2015
| Date | Buyer | Sale Price | Title Company |
|---|---|---|---|
| Palardy Robert | $293,500 | -- | |
| Palardy Robert | $293,500 | -- | |
| Ocean City Development | $140,000 | -- | |
| Ocean City Development | $140,000 | -- | |
| Glynn Victoria | $230,000 | -- | |
| Glynn Victoria | $230,000 | -- | |
| Gollock Daniel F | $150,000 | -- | |
| Gollock Daniel F | $150,000 | -- |
| Date | Status | Borrower | Loan Amount |
|---|---|---|---|
| Open | Palardy Robert | $284,650 | |
| Closed | Palardy Robert | $284,650 | |
| Previous Owner | Ocean City Development | $172,000 | |
| Previous Owner | Gollock Daniel F | $36,000 | |
| Previous Owner | Gollock Daniel F | $180,000 |
| Date | Event | Price | List to Sale | Price per Sq Ft | Prior Sale |
|---|---|---|---|---|---|
| 06/03/2016 06/03/16 | Sold | $293,500 | +3.0% | $271 / Sq Ft | |
| 04/24/2016 04/24/16 | Pending | -- | -- | -- | |
| 04/06/2016 04/06/16 | For Sale | $284,900 | -2.9% | $263 / Sq Ft | |
| 01/07/2016 01/07/16 | Off Market | $293,500 | -- | -- | |
| 12/16/2015 12/16/15 | Price Changed | $284,900 | -5.0% | $263 / Sq Ft | |
| 10/06/2015 10/06/15 | For Sale | $299,900 | +114.2% | $277 / Sq Ft | |
| 06/12/2015 06/12/15 | Sold | $140,000 | +12.0% | $129 / Sq Ft | View Prior Sale |
| 03/04/2015 03/04/15 | Pending | -- | -- | -- | |
| 02/28/2015 02/28/15 | For Sale | $125,000 | -10.7% | $115 / Sq Ft | |
| 12/03/2014 12/03/14 | Off Market | $140,000 | -- | -- | |
| 11/19/2014 11/19/14 | Price Changed | $125,000 | -10.7% | $115 / Sq Ft | |
| 10/08/2014 10/08/14 | Price Changed | $139,900 | -6.7% | $129 / Sq Ft | |
| 09/09/2014 09/09/14 | Price Changed | $149,900 | -12.3% | $138 / Sq Ft | |
| 07/01/2014 07/01/14 | For Sale | $171,000 | +22.1% | $158 / Sq Ft | |
| 06/30/2014 06/30/14 | Off Market | $140,000 | -- | -- | |
| 05/28/2014 05/28/14 | Price Changed | $171,000 | 0.0% | $158 / Sq Ft | |
| 05/28/2014 05/28/14 | For Sale | $171,000 | +22.1% | $158 / Sq Ft | |
| 03/31/2014 03/31/14 | Off Market | $140,000 | -- | -- | |
| 02/24/2014 02/24/14 | Price Changed | $150,000 | -6.3% | $138 / Sq Ft | |
| 02/10/2014 02/10/14 | Price Changed | $160,000 | -5.9% | $148 / Sq Ft | |
| 01/27/2014 01/27/14 | Price Changed | $170,000 | -8.1% | $157 / Sq Ft | |
| 12/20/2013 12/20/13 | Price Changed | $185,000 | 0.0% | $171 / Sq Ft | |
| 12/20/2013 12/20/13 | For Sale | $185,000 | +42.4% | $171 / Sq Ft | |
| 02/01/2013 02/01/13 | Pending | -- | -- | -- | |
| 01/21/2013 01/21/13 | Price Changed | $129,900 | -13.3% | $120 / Sq Ft | |
| 12/11/2012 12/11/12 | Price Changed | $149,900 | -14.3% | $138 / Sq Ft | |
| 11/30/2012 11/30/12 | Price Changed | $174,900 | -5.4% | $161 / Sq Ft | |
| 11/07/2012 11/07/12 | Price Changed | $184,900 | -7.5% | $171 / Sq Ft | |
| 10/17/2012 10/17/12 | For Sale | $199,900 | -- | $184 / Sq Ft |
| Year | Tax Paid | Tax Assessment Tax Assessment Total Assessment is a certain percentage of the fair market value that is determined by local assessors to be the total taxable value of land and additions on the property. | Land | Improvement |
|---|---|---|---|---|
| 2025 | $4,264 | $572,400 | $316,400 | $256,000 |
| 2024 | $4,052 | $527,600 | $283,100 | $244,500 |
| 2023 | $4,025 | $464,200 | $241,400 | $222,800 |
| 2022 | $3,994 | $410,500 | $216,500 | $194,000 |
| 2021 | $3,719 | $348,900 | $166,500 | $182,400 |
| 2020 | $3,771 | $343,100 | $166,500 | $176,600 |
| 2019 | $3,529 | $326,500 | $149,900 | $176,600 |
| 2018 | $3,402 | $312,100 | $149,900 | $162,200 |
| 2017 | $3,266 | $307,800 | $149,900 | $157,900 |
| 2016 | $2,839 | $249,000 | $116,600 | $132,400 |
| 2015 | $2,724 | $236,500 | $108,200 | $128,300 |
| 2014 | $2,677 | $236,500 | $108,200 | $128,300 |
S
Seller's Agent in 2016
Sabrina Mandell
Cameron Real Estate Group

Buyer's Agent in 2016
John Laffy
Laer Realty
(978) 273-1113
2 in this area
23 Total Sales
T
Seller's Agent in 2015
Tom Mahoney
Coldwell Banker Realty
(239) 963-4223
3 in this area
71 Total Sales
Source: MLS Property Information Network (MLS PIN)
MLS Number: 71915214
APN: NEWB-000011U-000000-000012
Disclaimer: Certain information contained herein is derived from information provided by parties other than Homes.com. All information provided is deemed reliable, but is not guaranteed to be accurate and should be independently verified.
![]() The property listing data and information, or the Images, set forth herein were provided to MLS Property Information Network, Inc. from third party sources, including sellers, lessors and public records, and were compiled by MLS Property Information Network, Inc. The property listing data and information, and the Images, are for the personal, non-commercial use of consumers having a good faith interest in purchasing or leasing listed properties of the type displayed to them and may not be used for any purpose other than to identify prospective properties which such consumers may have a good faith interest in purchasing or leasing. MLS Property Information Network, Inc. and its subscribers disclaim any and all representations and warranties as to the accuracy of the property listing data and information, or as to the accuracy of any of the Images, set forth herein.
The property listing data and information, or the Images, set forth herein were provided to MLS Property Information Network, Inc. from third party sources, including sellers, lessors and public records, and were compiled by MLS Property Information Network, Inc. The property listing data and information, and the Images, are for the personal, non-commercial use of consumers having a good faith interest in purchasing or leasing listed properties of the type displayed to them and may not be used for any purpose other than to identify prospective properties which such consumers may have a good faith interest in purchasing or leasing. MLS Property Information Network, Inc. and its subscribers disclaim any and all representations and warranties as to the accuracy of the property listing data and information, or as to the accuracy of any of the Images, set forth herein.
Ask me questions while you tour the home.