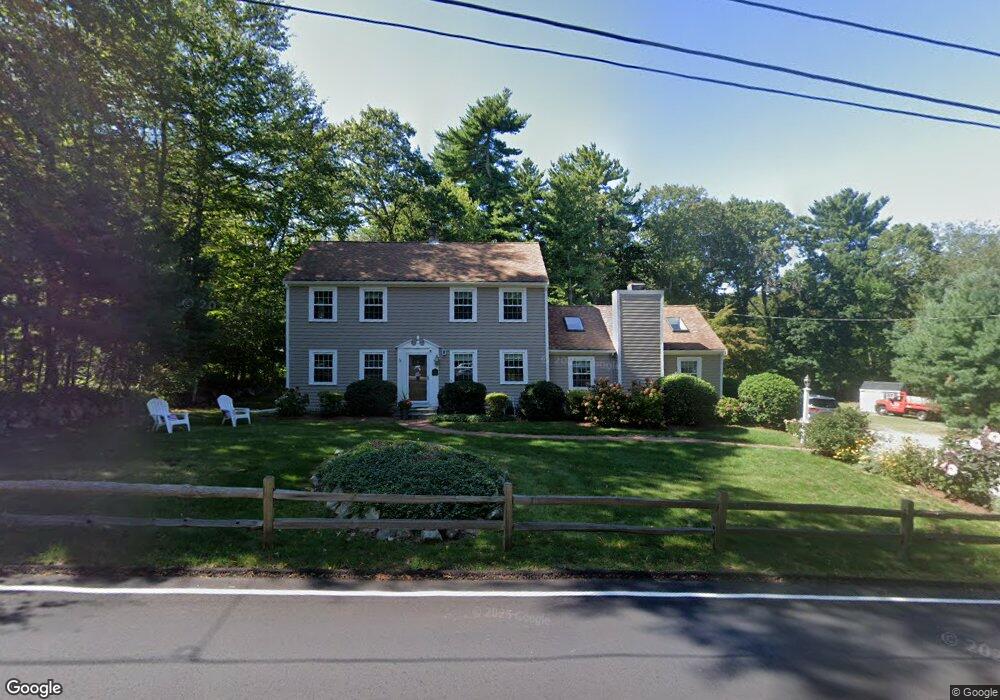
70 Maple St Scituate, MA 02066
Estimated Value: $835,000 - $1,094,000
3
Beds
2
Baths
2,278
Sq Ft
$421/Sq Ft
Est. Value
About This Home
This home is located at 70 Maple St, Scituate, MA 02066 and is currently estimated at $960,110, approximately $421 per square foot. 70 Maple St is a home located in Plymouth County with nearby schools including Cushing Elementary School, Lester J. Gates Middle School, and Scituate High School.
Ownership History
Date
Name
Owned For
Owner Type
Purchase Details
Closed on
Aug 15, 2023
Sold by
Odonnell Terrence F and Odonnell Deborah A
Bought by
Odonnell Ft and Odonnell
Current Estimated Value
Purchase Details
Closed on
Sep 5, 2003
Sold by
Gagliano Sam J and Gagliano Carole J
Bought by
Odonnell Terrance F and Sanborn Deborah A
Home Financials for this Owner
Home Financials are based on the most recent Mortgage that was taken out on this home.
Original Mortgage
$360,000
Interest Rate
6.02%
Mortgage Type
Purchase Money Mortgage
Purchase Details
Closed on
Jun 26, 1992
Sold by
Cuneo Brian L and Cuneo Maureen
Bought by
Gagliano Sam J and Gagliano Carole
Home Financials for this Owner
Home Financials are based on the most recent Mortgage that was taken out on this home.
Original Mortgage
$159,900
Interest Rate
8.57%
Mortgage Type
Purchase Money Mortgage
Create a Home Valuation Report for This Property
The Home Valuation Report is an in-depth analysis detailing your home's value as well as a comparison with similar homes in the area
Home Values in the Area
Average Home Value in this Area
Purchase History
| Date | Buyer | Sale Price | Title Company |
|---|---|---|---|
| Odonnell Ft | -- | None Available | |
| Odonnell Terrance F | $488,000 | -- | |
| Gagliano Sam J | $199,900 | -- | |
| Gagliano Sam J | $199,900 | -- |
Source: Public Records
Mortgage History
| Date | Status | Borrower | Loan Amount |
|---|---|---|---|
| Previous Owner | Gagliano Sam J | $50,000 | |
| Previous Owner | Gagliano Sam J | $360,000 | |
| Previous Owner | Gagliano Sam J | $159,900 |
Source: Public Records
Tax History
| Year | Tax Paid | Tax Assessment Tax Assessment Total Assessment is a certain percentage of the fair market value that is determined by local assessors to be the total taxable value of land and additions on the property. | Land | Improvement |
|---|---|---|---|---|
| 2025 | $7,610 | $761,800 | $378,000 | $383,800 |
| 2024 | $7,459 | $720,000 | $343,600 | $376,400 |
| 2023 | $7,420 | $666,700 | $312,400 | $354,300 |
| 2022 | $7,209 | $571,200 | $274,000 | $297,200 |
| 2021 | $6,984 | $523,900 | $261,000 | $262,900 |
| 2020 | $6,815 | $504,800 | $250,900 | $253,900 |
| 2019 | $6,674 | $485,700 | $246,000 | $239,700 |
| 2018 | $6,669 | $478,100 | $262,700 | $215,400 |
| 2017 | $6,276 | $445,400 | $238,800 | $206,600 |
| 2016 | $6,128 | $433,400 | $226,800 | $206,600 |
| 2015 | $5,522 | $421,500 | $214,900 | $206,600 |
Source: Public Records
Map
Nearby Homes
- 627 First Parish Rd
- 537 First Parish Rd
- 764 First Parish Rd
- 2 Webster Farm Way
- 293 Cross St
- 327 Country Way
- 25 Webster Farm Way
- 23 Webster Farm Way
- 3 Webster Farm Way
- 5 Webster Farm Way
- 94 Old Oaken Bucket Rd
- 67 Pratt Rd
- 98 Satuit Trail
- 20 Grace Way Unit 20
- 6 Grace Way Unit 6
- 27 Grace Way
- 19 Dunster Ln
- 115 Elm St
- 111 Elm St
- 11 Forest Ln
Your Personal Tour Guide
Ask me questions while you tour the home.