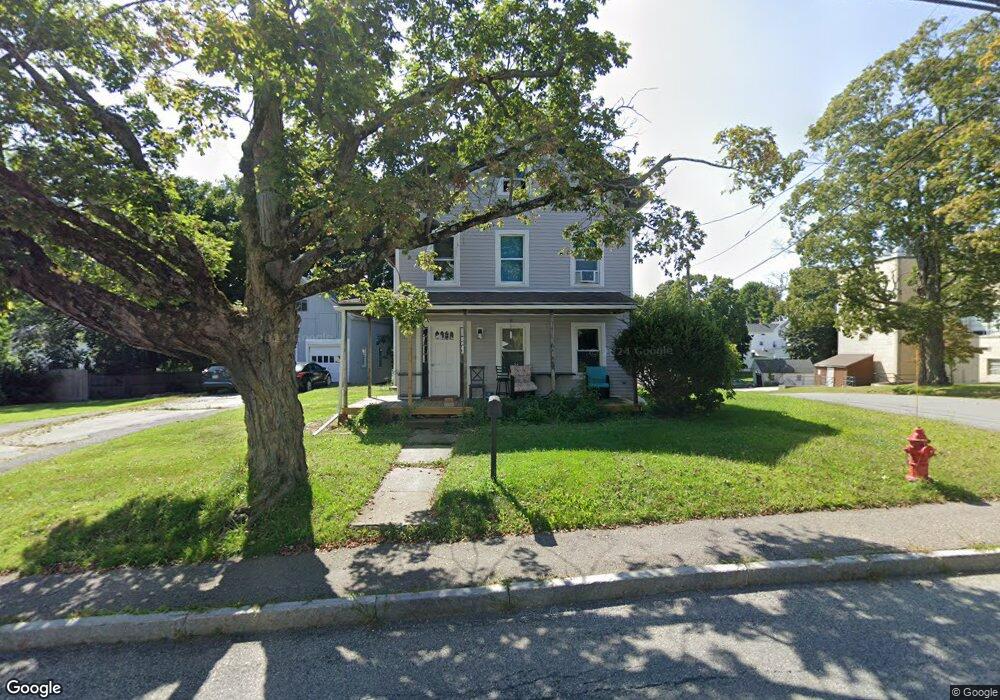
70 Maple St Spencer, MA 01562
Estimated Value: $386,000 - $495,000
6
Beds
2
Baths
1,913
Sq Ft
$227/Sq Ft
Est. Value
About This Home
This home is located at 70 Maple St, Spencer, MA 01562 and is currently estimated at $434,330, approximately $227 per square foot. 70 Maple St is a home located in Worcester County with nearby schools including David Prouty High School.
Ownership History
Date
Name
Owned For
Owner Type
Purchase Details
Closed on
Jun 28, 2023
Sold by
Mc Renovations Llc
Bought by
Nelson Kathleen M and Lapointe Stefanie L
Current Estimated Value
Home Financials for this Owner
Home Financials are based on the most recent Mortgage that was taken out on this home.
Original Mortgage
$311,250
Outstanding Balance
$302,595
Interest Rate
6.39%
Mortgage Type
Purchase Money Mortgage
Estimated Equity
$131,735
Purchase Details
Closed on
Jan 13, 2023
Sold by
Stevens Cynthia L and Stevens Edwin T
Bought by
Mc Renovations Llc
Home Financials for this Owner
Home Financials are based on the most recent Mortgage that was taken out on this home.
Original Mortgage
$319,300
Interest Rate
6.49%
Mortgage Type
Purchase Money Mortgage
Purchase Details
Closed on
Jan 24, 1995
Sold by
Salem Richard P and Walsh David
Bought by
Stevens Edwin and Stevens Peter
Home Financials for this Owner
Home Financials are based on the most recent Mortgage that was taken out on this home.
Original Mortgage
$81,000
Interest Rate
9.16%
Mortgage Type
Purchase Money Mortgage
Purchase Details
Closed on
Jun 28, 1991
Sold by
Gebo Christopher T
Bought by
Larson Kent R and Larson Lydia
Create a Home Valuation Report for This Property
The Home Valuation Report is an in-depth analysis detailing your home's value as well as a comparison with similar homes in the area
Home Values in the Area
Average Home Value in this Area
Purchase History
| Date | Buyer | Sale Price | Title Company |
|---|---|---|---|
| Nelson Kathleen M | $415,000 | None Available | |
| Mc Renovations Llc | $190,000 | None Available | |
| Stevens Edwin | $90,000 | -- | |
| Larson Kent R | $145,000 | -- |
Source: Public Records
Mortgage History
| Date | Status | Borrower | Loan Amount |
|---|---|---|---|
| Open | Nelson Kathleen M | $311,250 | |
| Previous Owner | Mc Renovations Llc | $319,300 | |
| Previous Owner | Larson Kent R | $124,800 | |
| Previous Owner | Larson Kent R | $124,800 | |
| Previous Owner | Larson Kent R | $81,000 |
Source: Public Records
Tax History
| Year | Tax Paid | Tax Assessment Tax Assessment Total Assessment is a certain percentage of the fair market value that is determined by local assessors to be the total taxable value of land and additions on the property. | Land | Improvement |
|---|---|---|---|---|
| 2025 | $45 | $380,900 | $42,000 | $338,900 |
| 2024 | $2,811 | $245,700 | $42,000 | $203,700 |
| 2023 | $2,693 | $223,300 | $42,000 | $181,300 |
| 2022 | $2,704 | $205,500 | $38,200 | $167,300 |
| 2021 | $2,356 | $167,800 | $38,200 | $129,600 |
| 2020 | $2,251 | $159,400 | $38,200 | $121,200 |
| 2019 | $2,071 | $149,400 | $33,000 | $116,400 |
| 2018 | $1,876 | $139,800 | $40,100 | $99,700 |
| 2017 | $1,928 | $137,900 | $38,200 | $99,700 |
| 2016 | $1,969 | $137,800 | $38,200 | $99,600 |
| 2015 | $1,984 | $145,100 | $43,900 | $101,200 |
| 2014 | $1,908 | $145,100 | $43,900 | $101,200 |
Source: Public Records
Map
Nearby Homes
Your Personal Tour Guide
Ask me questions while you tour the home.