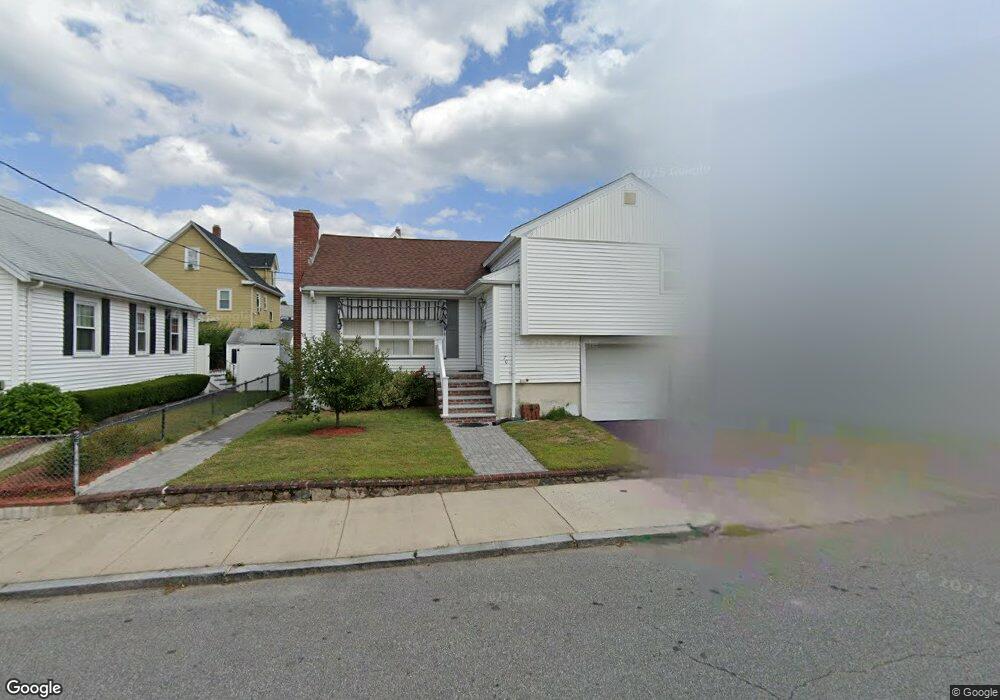
70 Maynard St Malden, MA 02148
Linden NeighborhoodEstimated Value: $639,000 - $755,000
3
Beds
4
Baths
1,753
Sq Ft
$400/Sq Ft
Est. Value
About This Home
This home is located at 70 Maynard St, Malden, MA 02148 and is currently estimated at $700,899, approximately $399 per square foot. 70 Maynard St is a home located in Middlesex County with nearby schools including Malden High School and Malden Catholic.
Ownership History
Date
Name
Owned For
Owner Type
Purchase Details
Closed on
Jan 14, 2014
Sold by
Cocco Marie E and Cocco Stephen A
Bought by
Parada Jonathan J and Vargas Stephannie M
Current Estimated Value
Home Financials for this Owner
Home Financials are based on the most recent Mortgage that was taken out on this home.
Original Mortgage
$279,437
Outstanding Balance
$210,147
Interest Rate
4.29%
Mortgage Type
New Conventional
Estimated Equity
$490,752
Create a Home Valuation Report for This Property
The Home Valuation Report is an in-depth analysis detailing your home's value as well as a comparison with similar homes in the area
Home Values in the Area
Average Home Value in this Area
Purchase History
| Date | Buyer | Sale Price | Title Company |
|---|---|---|---|
| Parada Jonathan J | $302,000 | -- |
Source: Public Records
Mortgage History
| Date | Status | Borrower | Loan Amount |
|---|---|---|---|
| Open | Parada Jonathan J | $279,437 |
Source: Public Records
Tax History Compared to Growth
Tax History
| Year | Tax Paid | Tax Assessment Tax Assessment Total Assessment is a certain percentage of the fair market value that is determined by local assessors to be the total taxable value of land and additions on the property. | Land | Improvement |
|---|---|---|---|---|
| 2025 | $61 | $541,600 | $265,600 | $276,000 |
| 2024 | $6,082 | $520,300 | $250,000 | $270,300 |
| 2023 | $5,991 | $491,500 | $226,600 | $264,900 |
| 2022 | $5,737 | $464,500 | $207,000 | $257,500 |
| 2021 | $5,473 | $445,300 | $195,300 | $250,000 |
| 2020 | $5,090 | $402,400 | $180,500 | $221,900 |
| 2019 | $5,174 | $389,900 | $171,900 | $218,000 |
| 2018 | $4,975 | $353,100 | $142,600 | $210,500 |
| 2017 | $4,748 | $335,100 | $142,600 | $192,500 |
| 2016 | $4,245 | $280,000 | $130,900 | $149,100 |
| 2015 | $4,349 | $276,500 | $124,600 | $151,900 |
| 2014 | $4,270 | $265,200 | $113,300 | $151,900 |
Source: Public Records
Map
Nearby Homes
- 19 Bellvale St
- 1135 Salem St
- 33 Blaine St
- 4 Anderson Way Unit 2
- 363 Broadway
- 75 Goldie St
- 770 Washington Ave Unit 405
- 563 Lynn St
- 36 Central Ave
- 48 Summit St
- 32 Delta Terrace
- 14 Dodge St
- 98 Summit St
- 690 Washington Ave
- 33 Lodgen Ct Unit 4G
- 82 Elwell St
- 112 Hadley St
- 18 Lynn St
- 44 Loomis St Unit 209
- 35-35B Beachview Ave
- 66 Maynard St
- 187 Oliver St
- 69 Bellvale St
- 73 Bellvale St Unit 75
- 62 Maynard St
- 65 Bellvale St
- 73 Maynard St Unit 2
- 73 Maynard St
- 73 Maynard St Unit 1
- 73 Maynard St Unit 73A
- 73 Maynard St Unit 73B
- 67 Maynard St
- 63 Maynard St
- 61 Bellvale St
- 60 Maynard St
- 184 Oliver St
- 59 Maynard St Unit 61
- 186 Oliver St
- 176 Oliver St Unit 178
- 176 Oliver St Unit 176