Estimated Value: $673,000 - $852,000
--
Bed
--
Bath
3,808
Sq Ft
$200/Sq Ft
Est. Value
About This Home
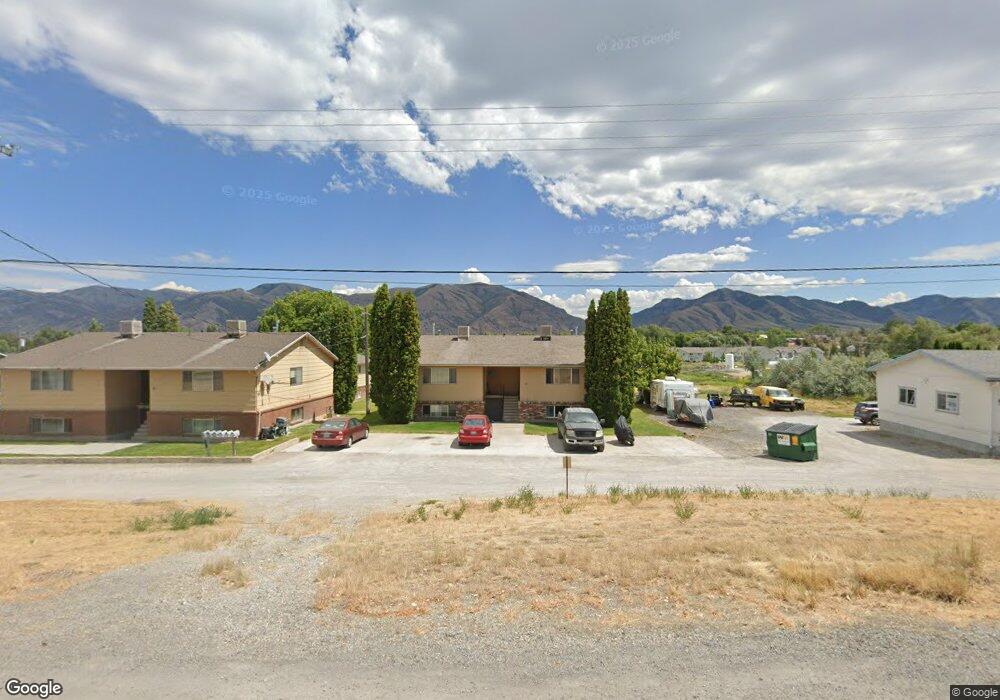
This home is located at 70 N 400 W, Hyrum, UT 84319 and is currently estimated at $762,500, approximately $200 per square foot. 70 N 400 W is a home with nearby schools including Lincoln School, South Cache Middle School, and Mountain Crest High School.
Ownership History
Date
Name
Owned For
Owner Type
Purchase Details
Closed on
Apr 27, 2020
Sold by
Wilson Rick L
Bought by
Wilson Apartments 70 Llc
Current Estimated Value
Purchase Details
Closed on
Mar 5, 2013
Sold by
Wilson Ricky L
Bought by
Wilson Rick L
Home Financials for this Owner
Home Financials are based on the most recent Mortgage that was taken out on this home.
Original Mortgage
$116,070
Interest Rate
3.4%
Mortgage Type
New Conventional
Purchase Details
Closed on
Oct 5, 2012
Sold by
Wilson Apartments 70 Llc
Bought by
Wilson Ricky L
Create a Home Valuation Report for This Property
The Home Valuation Report is an in-depth analysis detailing your home's value as well as a comparison with similar homes in the area
Home Values in the Area
Average Home Value in this Area
Purchase History
| Date | Buyer | Sale Price | Title Company |
|---|---|---|---|
| Wilson Apartments 70 Llc | -- | None Available | |
| Wilson Rick L | -- | Hickman Land Title Company | |
| Wilson Ricky L | -- | Hickman Land Title Company |
Source: Public Records
Mortgage History
| Date | Status | Borrower | Loan Amount |
|---|---|---|---|
| Previous Owner | Wilson Rick L | $116,070 |
Source: Public Records
Tax History Compared to Growth
Tax History
| Year | Tax Paid | Tax Assessment Tax Assessment Total Assessment is a certain percentage of the fair market value that is determined by local assessors to be the total taxable value of land and additions on the property. | Land | Improvement |
|---|---|---|---|---|
| 2025 | $2,373 | $619,470 | $215,000 | $404,470 |
| 2024 | $2,541 | $619,470 | $215,000 | $404,470 |
| 2023 | $2,303 | $536,870 | $132,400 | $404,470 |
| 2022 | $2,404 | $536,870 | $132,400 | $404,470 |
| 2021 | $264 | $500,100 | $132,400 | $367,700 |
| 2020 | $1,684 | $299,100 | $90,000 | $209,100 |
| 2019 | $1,790 | $299,100 | $90,000 | $209,100 |
| 2018 | $1,416 | $228,632 | $65,000 | $163,632 |
| 2017 | $1,385 | $116,105 | $0 | $0 |
| 2016 | $1,417 | $116,105 | $0 | $0 |
| 2015 | $1,420 | $116,105 | $0 | $0 |
| 2014 | $1,316 | $110,055 | $0 | $0 |
| 2013 | -- | $103,045 | $0 | $0 |
Source: Public Records
Map
Nearby Homes