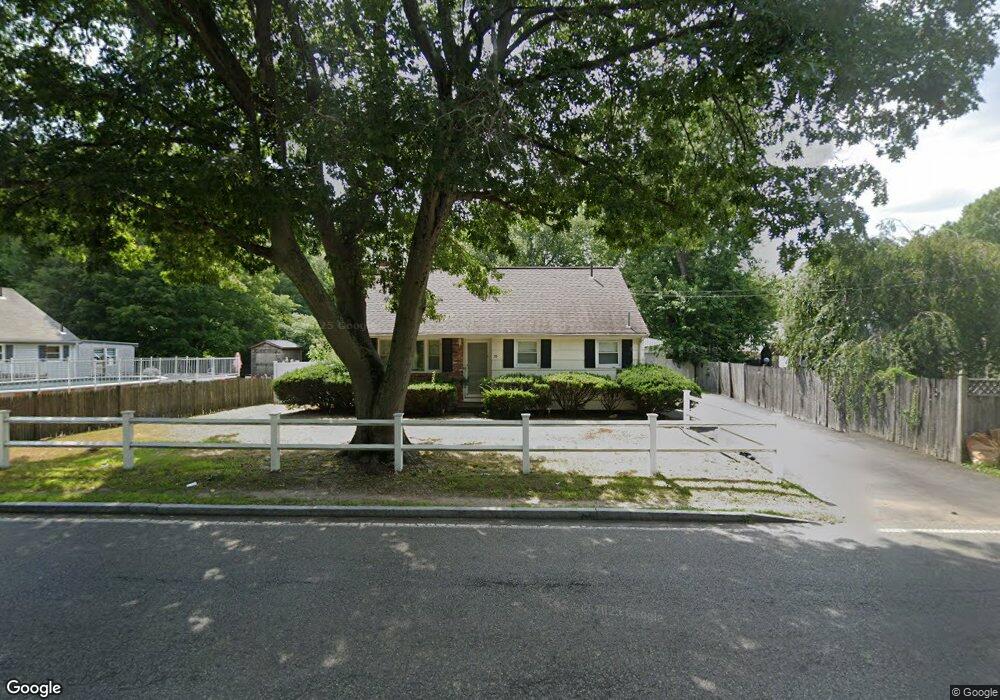
70 N Cary St Brockton, MA 02302
Estimated Value: $470,000 - $545,000
3
Beds
2
Baths
1,386
Sq Ft
$368/Sq Ft
Est. Value
About This Home
This home is located at 70 N Cary St, Brockton, MA 02302 and is currently estimated at $510,059, approximately $368 per square foot. 70 N Cary St is a home located in Plymouth County with nearby schools including Arnone Elementary School, Joseph F. Plouffe Middle School, and Brockton Area Seventh-Day Adventist Academy.
Ownership History
Date
Name
Owned For
Owner Type
Purchase Details
Closed on
Dec 27, 2002
Sold by
Givens Wayne and Givens Deborah A
Bought by
Givens Deborah A
Current Estimated Value
Home Financials for this Owner
Home Financials are based on the most recent Mortgage that was taken out on this home.
Original Mortgage
$50,000
Interest Rate
6.16%
Purchase Details
Closed on
Sep 1, 1987
Sold by
Soderholm Ingmar O
Bought by
Givens Wayne
Home Financials for this Owner
Home Financials are based on the most recent Mortgage that was taken out on this home.
Original Mortgage
$103,900
Interest Rate
10.24%
Mortgage Type
Purchase Money Mortgage
Create a Home Valuation Report for This Property
The Home Valuation Report is an in-depth analysis detailing your home's value as well as a comparison with similar homes in the area
Home Values in the Area
Average Home Value in this Area
Purchase History
| Date | Buyer | Sale Price | Title Company |
|---|---|---|---|
| Givens Deborah A | $8,577 | -- | |
| Givens Wayne | $129,900 | -- |
Source: Public Records
Mortgage History
| Date | Status | Borrower | Loan Amount |
|---|---|---|---|
| Open | Givens Wayne | $100,000 | |
| Closed | Givens Wayne | $50,000 | |
| Previous Owner | Givens Wayne | $108,200 | |
| Previous Owner | Givens Wayne | $103,900 |
Source: Public Records
Tax History Compared to Growth
Tax History
| Year | Tax Paid | Tax Assessment Tax Assessment Total Assessment is a certain percentage of the fair market value that is determined by local assessors to be the total taxable value of land and additions on the property. | Land | Improvement |
|---|---|---|---|---|
| 2025 | $4,980 | $411,200 | $140,000 | $271,200 |
| 2024 | $4,931 | $410,200 | $140,000 | $270,200 |
| 2023 | $4,922 | $379,200 | $104,000 | $275,200 |
| 2022 | $4,564 | $326,700 | $94,500 | $232,200 |
| 2021 | $4,283 | $295,400 | $78,400 | $217,000 |
| 2020 | $3,963 | $261,600 | $73,500 | $188,100 |
| 2019 | $3,980 | $256,100 | $71,800 | $184,300 |
| 2018 | $3,766 | $234,500 | $71,800 | $162,700 |
| 2017 | $3,175 | $197,200 | $71,800 | $125,400 |
| 2016 | $3,198 | $184,200 | $69,500 | $114,700 |
| 2015 | $2,938 | $161,900 | $69,500 | $92,400 |
| 2014 | $3,093 | $170,600 | $69,500 | $101,100 |
Source: Public Records
Map
Nearby Homes