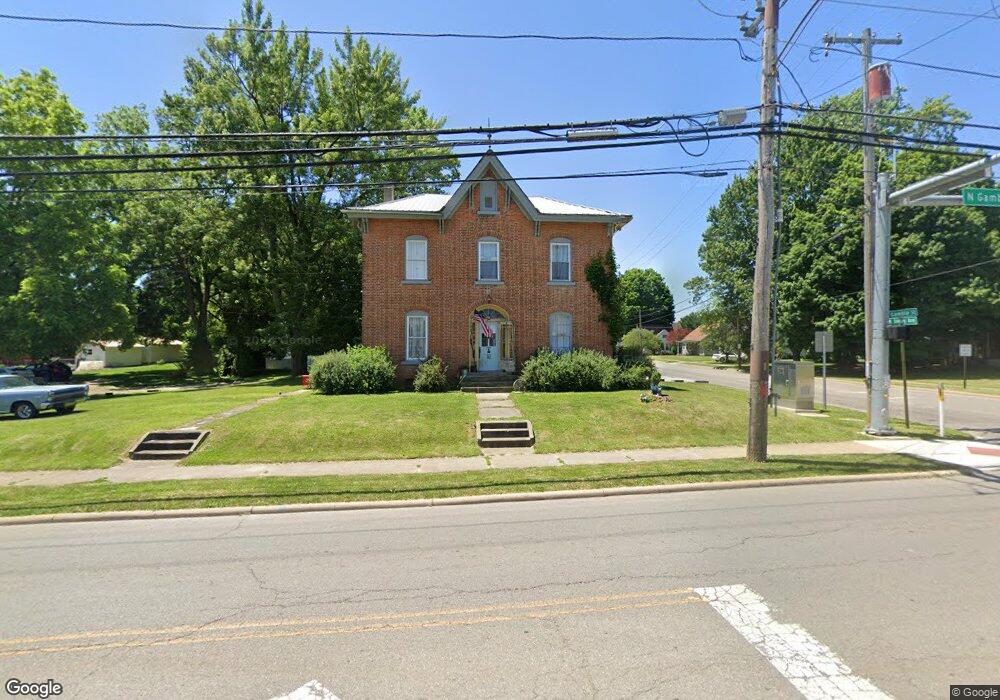
70 N Gamble St Shelby, OH 44875
Estimated Value: $110,000 - $137,618
5
Beds
3
Baths
2,608
Sq Ft
$48/Sq Ft
Est. Value
About This Home
This home is located at 70 N Gamble St, Shelby, OH 44875 and is currently estimated at $125,905, approximately $48 per square foot. 70 N Gamble St is a home located in Richland County with nearby schools including St. Mary's School.
Ownership History
Date
Name
Owned For
Owner Type
Purchase Details
Closed on
Jun 14, 2019
Sold by
Shcartigers Llc
Bought by
Schartiger Douglas
Current Estimated Value
Home Financials for this Owner
Home Financials are based on the most recent Mortgage that was taken out on this home.
Original Mortgage
$100,000
Outstanding Balance
$87,924
Interest Rate
4.1%
Mortgage Type
Purchase Money Mortgage
Estimated Equity
$37,981
Purchase Details
Closed on
Jul 3, 2018
Sold by
Schartiger Janelle M and Schartiger Janelle Mae Gilliam
Bought by
Schartigers Llc
Purchase Details
Closed on
Apr 6, 2012
Sold by
Gay Retha M
Bought by
Shartiger Janelle Mae Gilliam
Purchase Details
Closed on
Sep 27, 1991
Sold by
Barnes Joyce A
Bought by
Gay Retha
Create a Home Valuation Report for This Property
The Home Valuation Report is an in-depth analysis detailing your home's value as well as a comparison with similar homes in the area
Home Values in the Area
Average Home Value in this Area
Purchase History
| Date | Buyer | Sale Price | Title Company |
|---|---|---|---|
| Schartiger Douglas | -- | Barrister Title Group | |
| Schartigers Llc | -- | None Available | |
| Shartiger Janelle Mae Gilliam | -- | Attorney | |
| Gay Retha | $39,000 | -- |
Source: Public Records
Mortgage History
| Date | Status | Borrower | Loan Amount |
|---|---|---|---|
| Open | Schartiger Douglas | $100,000 |
Source: Public Records
Tax History Compared to Growth
Tax History
| Year | Tax Paid | Tax Assessment Tax Assessment Total Assessment is a certain percentage of the fair market value that is determined by local assessors to be the total taxable value of land and additions on the property. | Land | Improvement |
|---|---|---|---|---|
| 2024 | $1,081 | $26,940 | $6,200 | $20,740 |
| 2023 | $1,029 | $35,540 | $6,200 | $29,340 |
| 2022 | $1,077 | $25,200 | $5,930 | $19,270 |
| 2021 | $1,077 | $25,200 | $5,930 | $19,270 |
| 2020 | $1,215 | $28,410 | $5,930 | $22,480 |
| 2019 | $1,123 | $24,080 | $5,030 | $19,050 |
| 2018 | $1,112 | $24,080 | $5,030 | $19,050 |
| 2017 | $1,101 | $24,080 | $5,030 | $19,050 |
| 2016 | $1,037 | $22,820 | $4,770 | $18,050 |
| 2015 | $1,037 | $22,820 | $4,770 | $18,050 |
| 2014 | $996 | $22,820 | $4,770 | $18,050 |
| 2012 | $516 | $24,020 | $5,030 | $18,990 |
Source: Public Records
Map
Nearby Homes