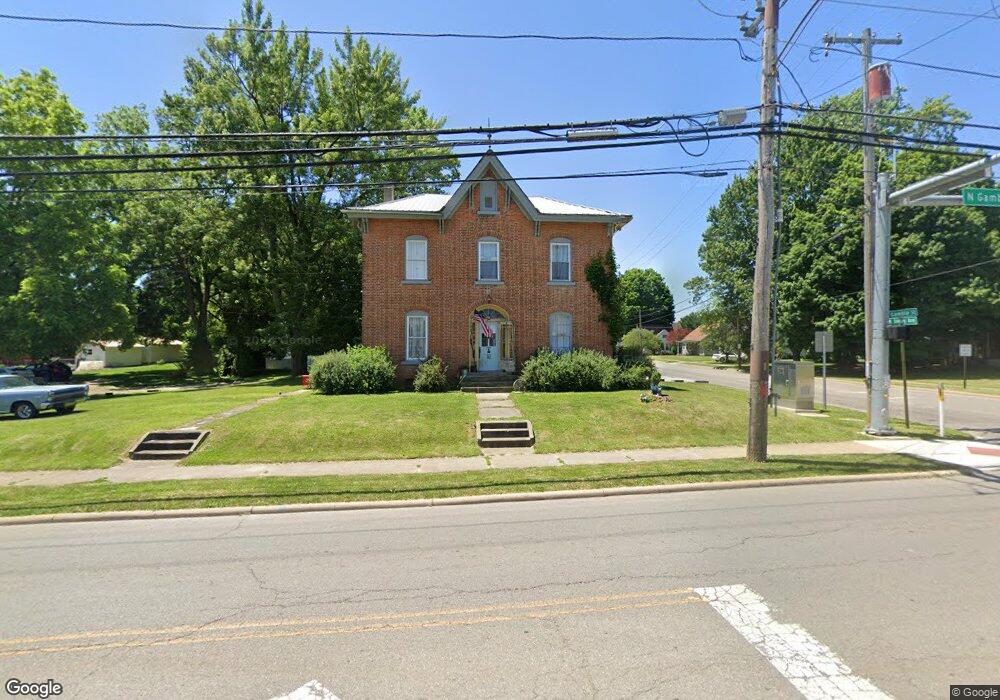
70 N Gamble St Shelby, OH 44875
Estimated Value: $110,000 - $129,000
4
Beds
2
Baths
2,312
Sq Ft
$51/Sq Ft
Est. Value
About This Home
This home is located at 70 N Gamble St, Shelby, OH 44875 and is currently estimated at $116,970, approximately $50 per square foot. 70 N Gamble St is a home located in Richland County with nearby schools including St. Mary's School.
Ownership History
Date
Name
Owned For
Owner Type
Purchase Details
Closed on
Mar 11, 2019
Sold by
Stidam Beth Ann
Bought by
Robinette Denim Jason Lynn and Green Juanita Marie
Current Estimated Value
Purchase Details
Closed on
Apr 10, 2007
Sold by
Fried Harvey L and Fried Brenda C
Bought by
Stidam Beth A
Purchase Details
Closed on
Oct 17, 2005
Sold by
Fried Brenda C and Fried Harvey L
Bought by
Fried Harvey L
Purchase Details
Closed on
Sep 9, 2005
Sold by
Robinette Denim J L
Bought by
Fried Harvey L and Fried Brenda C
Purchase Details
Closed on
Jan 10, 2001
Sold by
Stidam Beth A
Bought by
Robinette Denim J L
Purchase Details
Closed on
Oct 23, 1992
Sold by
Pfahler Roger H
Bought by
Stidam Beth A
Create a Home Valuation Report for This Property
The Home Valuation Report is an in-depth analysis detailing your home's value as well as a comparison with similar homes in the area
Home Values in the Area
Average Home Value in this Area
Purchase History
| Date | Buyer | Sale Price | Title Company |
|---|---|---|---|
| Robinette Denim Jason Lynn | -- | None Available | |
| Stidam Beth A | -- | None Available | |
| Fried Harvey L | -- | None Available | |
| Fried Harvey L | $26,000 | -- | |
| Robinette Denim J L | $50,000 | -- | |
| Stidam Beth A | $53,000 | -- |
Source: Public Records
Mortgage History
| Date | Status | Borrower | Loan Amount |
|---|---|---|---|
| Closed | Robinette Denim J L | -- |
Source: Public Records
Tax History Compared to Growth
Tax History
| Year | Tax Paid | Tax Assessment Tax Assessment Total Assessment is a certain percentage of the fair market value that is determined by local assessors to be the total taxable value of land and additions on the property. | Land | Improvement |
|---|---|---|---|---|
| 2024 | $969 | $26,010 | $8,340 | $17,670 |
| 2023 | $969 | $26,010 | $8,340 | $17,670 |
| 2022 | $442 | $10,350 | $8,450 | $1,900 |
| 2021 | $442 | $10,350 | $8,450 | $1,900 |
| 2020 | $443 | $10,350 | $8,450 | $1,900 |
| 2019 | $409 | $8,770 | $7,160 | $1,610 |
| 2018 | $1,020 | $22,080 | $7,160 | $14,920 |
| 2017 | $702 | $22,080 | $7,160 | $14,920 |
| 2016 | $394 | $8,660 | $2,560 | $6,100 |
| 2015 | $391 | $8,660 | $2,560 | $6,100 |
| 2014 | $378 | $8,660 | $2,560 | $6,100 |
| 2012 | $196 | $9,120 | $2,700 | $6,420 |
Source: Public Records
Map
Nearby Homes