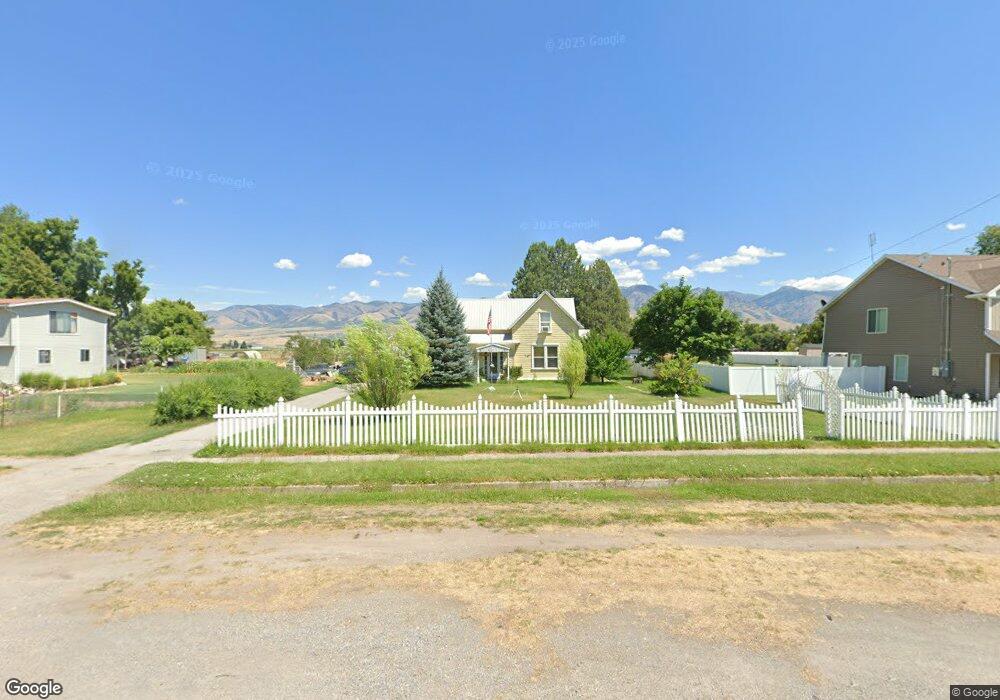
70 N Main St Lewiston, UT 84320
Estimated Value: $440,000 - $479,000
5
Beds
3
Baths
2,415
Sq Ft
$189/Sq Ft
Est. Value
About This Home
This home is located at 70 N Main St, Lewiston, UT 84320 and is currently estimated at $455,295, approximately $188 per square foot. 70 N Main St is a home located in Cache County with nearby schools including Lewiston School, White Pine Middle School, and North Cache Middle School.
Ownership History
Date
Name
Owned For
Owner Type
Purchase Details
Closed on
Dec 30, 2016
Sold by
Bonar Andrea T
Bought by
Kendall Melissa A and Kendall Garcy C
Current Estimated Value
Home Financials for this Owner
Home Financials are based on the most recent Mortgage that was taken out on this home.
Original Mortgage
$185,083
Outstanding Balance
$154,987
Interest Rate
4.87%
Mortgage Type
FHA
Estimated Equity
$300,308
Purchase Details
Closed on
Nov 21, 2016
Sold by
Bonar Bradley D
Bought by
Bonar Andrea T
Home Financials for this Owner
Home Financials are based on the most recent Mortgage that was taken out on this home.
Original Mortgage
$185,083
Outstanding Balance
$154,987
Interest Rate
4.87%
Mortgage Type
FHA
Estimated Equity
$300,308
Purchase Details
Closed on
Dec 26, 2006
Sold by
Fielding Enterprises Llc
Bought by
King Paul and King Linda R
Create a Home Valuation Report for This Property
The Home Valuation Report is an in-depth analysis detailing your home's value as well as a comparison with similar homes in the area
Home Values in the Area
Average Home Value in this Area
Purchase History
| Date | Buyer | Sale Price | Title Company |
|---|---|---|---|
| Kendall Melissa A | -- | American Secure Title | |
| Bonar Andrea T | -- | American Secure Title | |
| King Paul | -- | Accommodation |
Source: Public Records
Mortgage History
| Date | Status | Borrower | Loan Amount |
|---|---|---|---|
| Open | Kendall Melissa A | $185,083 |
Source: Public Records
Tax History Compared to Growth
Tax History
| Year | Tax Paid | Tax Assessment Tax Assessment Total Assessment is a certain percentage of the fair market value that is determined by local assessors to be the total taxable value of land and additions on the property. | Land | Improvement |
|---|---|---|---|---|
| 2025 | $2,047 | $264,675 | $0 | $0 |
| 2024 | $2,193 | $261,785 | $0 | $0 |
| 2023 | $2,329 | $261,195 | $0 | $0 |
| 2022 | $2,112 | $225,425 | $0 | $0 |
| 2021 | $187 | $308,816 | $56,200 | $252,616 |
| 2020 | $1,478 | $233,040 | $38,720 | $194,320 |
| 2019 | $1,547 | $233,040 | $38,720 | $194,320 |
| 2018 | $1,440 | $212,220 | $38,720 | $173,500 |
| 2017 | $1,365 | $106,765 | $0 | $0 |
| 2016 | $1,379 | $88,780 | $0 | $0 |
| 2015 | $1,144 | $88,780 | $0 | $0 |
| 2014 | $1,116 | $88,780 | $0 | $0 |
| 2013 | -- | $88,780 | $0 | $0 |
Source: Public Records
Map
Nearby Homes
- 50 W 300 S
- 80 W 300 S
- 930 S 800 E
- 12506 N 525 E Unit 6
- 12489 N 525 E
- 12455 N 525 E Unit 1
- 12455 N 525 E
- 12506 N 525 E
- 12484 N 525 E Unit 7
- 12521 N 525 E
- 12518 N 525 E Unit 5
- 12489 N 525 E Unit 2
- 2400 W
- 12484 N 525 E
- 12518 N 525 E
- 12456 N 525 E Unit 8
- 12521 N 525 E Unit 3
- 12456 N 525 E
- 435 E 1600 S Unit EAST
- 338 E 1600 S